New Map Reveals What Lies Below Greenland’s Ice
This map of ‘naked’ Greenland is the most detailed yet and can help in refining climate predictions

Using decades worth of survey data, a consortium of nearly 40 institutions around the world collaborated to figure out what Greenland looks like without all its ice. The result, recently published in the journal Geophysical Research Letters, is the most comprehensive and detailed map of the seafloor and bedrock under Greenland's ice cap ever produced, reports the BBC's Jonathan Amos. Not only does it offer a peek into one of the last unmapped spots on the planet, the data could help researchers better understand the condition of the ice and how it will respond to climate change.
According to a NASA press release, the space agency contributed data from its Ocean Melting Greenland campaign, which was combined with datasets collected from nearly 40 other institutions. The researchers compiled the data using a program called BedMachine, which is designed to map out ice sheets. The new maps were rendered into a visually understandable form by the British Antarctic Survey and presented this week at the Fall Meeting of the American Geophysical Union in New Orleans.
As Amos reports, figuring out what lies below the ice is critical for understanding how the ice sheet will behave as the oceans and the climate warms. “If you're trying to model an ice sheet, the single most important input is ice thickness,” geography professor at the University of Bristol Jonathan Bamber tells Amos. “Why’s that? Because velocity is proportional to the fourth power of thickness. So differences in thickness make for huge differences in the velocity of the ice in our models; and to things like thermodynamics, because thick ice is warmer than thin ice, and so on.”
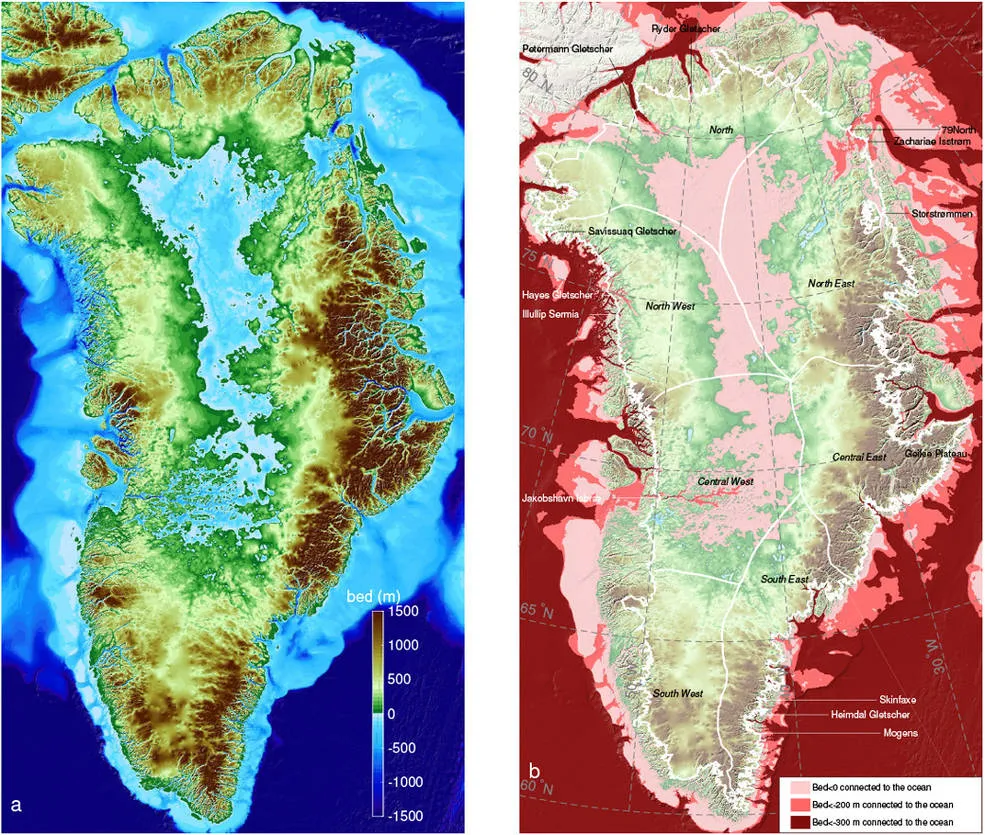
The map also suggests that Greenland’s glaciers may be affected by climate swings more rapidly than previously thought. According to an American Geophysical Union press release, two to four times as many glaciers along the coast of the ice sheet could experience accelerated melting than previously estimated. That’s because the upper layer of ocean surrounding Greenland, roughly the top 600 feet, consists of cold water streaming in from the Arctic. But the next 600 feet comes from warmer climes down south, brought up by the currents of the Atlantic conveyor belt. The new map reveals that double or even quadruple the number of glaciers than previously thought extend down into the warm zone.
“These results suggest that Greenland’s ice is more threatened by changing climate than we had anticipated,” says Josh Willis, Ocean Melting Greenland principal investigator at NASA’s Jet Propulsion Laboratory, who was not involved in the new maps, in NASA's press release.
In fact, about 80 percent of the ice lost from the Petermann Glacier, one of Greenland’s largest, comes from warm water melting the ice sheet from below, and not from calving icebergs, Kelly Hogan, a British Antarctic Survey researcher and co-author of the paper, tells Amos.
However, the process is not completely well understood, and Bamber tells Amos that the size, shape and geometry of Greenlands fjords can complicate the interactions between the ice sheet and the ocean. Figuring out just how the bedrock, ice and water interact is a hot area of research right now.
The maps are destined to get a little better each year. On October 23, NASA completed its second annual airborne survey of the ice. The researchers collected new measurements of ice height, ocean salinity and water temperature in more than 200 fjords around the island, all of which will be added to the Greenland maps.