New Technology Maps Greenhouse Gas Emissions at the Street and Neighborhood Level
The Hestia project draws on a variety of data sources to paint a comprehensive picture of a city’s greenhouse gas metabolism
/https://tf-cmsv2-smithsonianmag-media.s3.amazonaws.com/accounts/headshot/joseph-stromberg-240.jpg)
/https://tf-cmsv2-smithsonianmag-media.s3.amazonaws.com/filer/Surprising-GreenhouseMap-hero-631.jpg)
One of the biggest problems with climate change is that, at least in the short term, it’s largely invisible. Unlike many other environmental calamities—say, oil spills or forest fires—we simply can’t see the carbon dioxide that we emit when we drive a car or turn on an air conditioner.
Scientists can quantify the total amount of greenhouse gases emitted by a country, city or power plant, but it’s cognitively difficult to take that number and picture the actual impact of our actions on the long-term health of the climate. This factor, perhaps more than any other, has prevented significant action on climate change.
Now, software has been designed to make greenhouse gas emissions something we can actually see. In the Hestia Project, presented in a paper published yesterday in Environmental Science and Technology, researchers from Arizona State University created a technology that maps emissions at the street and neighborhood level, painting a rich picture of a city’s greenhouse gas metabolism. With their maps and videos—currently available for the city of Indianapolis—you can look at specific airports, roads and buildings and see how much carbon dioxide and other greenhouse gases each entity emits.
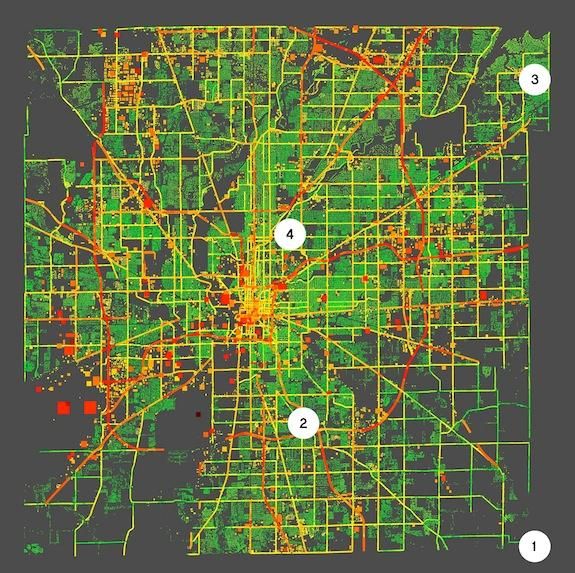
In the 3-D image above, each piece of land in Indianapolis is coded with a color according to the density of its carbon emissions, ranging from green (the lowest amount) to dark red (the highest). Additionally, the height of each bar represents the total amount of emissions for that building or road. As a consequence, most residential areas are green, while the highways and main roads that traverse the city are yellow or orange, while the industrial center, power plants and airports are a deep red.
Rates of emissions aren’t static, though—they change drastically over the course of a day and from season to season. So in addition to the maps and 3-D images that represent emissions at a given point of time, the project includes videos that show the fluctuations in a city’s emissions as energy use changes over the course of a business day, and compare emissions between summer and winter. Watch how Indianapolis’ residential emissions shift during the day, as people leave home (and turn off their heaters and air conditioners), then return at the end of the day:
In addition to helping us visualize greenhouse gas emissions in a more intuitive way, the researchers also see the project as useful for policymakers and engineers in figuring out where emissions can be most efficiently reduced. “Cities have had little information with which to guide reductions in greenhouse gas emissions—and you can’t reduce what you can’t measure,” said Kevin Gurney, the lead scientist behind the project. “With Hestia, we can provide cities with a complete, three-dimensional picture of where, when and how carbon dioxide emissions are occurring.”
The Hestia team is currently working on visualizations for Los Angeles and Phoenix and may eventually expand the platform for all major U.S. cities. At that point, it could serve a crucial component of an independent greenhouse gas emissions monitoring system, necessary for any large-scale effort to cap emissions.
Especially useful is the fact that the project draws upon data from a wide variety of sources—including local air pollution reports, property tax assessors’ information about the size and age of buildings and automated traffic tracking systems—so opponents of emissions regulations find it difficult to argue that municipalities could doctor statistics to alter their totals. “ may help overcome current barriers to the United States joining an international climate change treaty,” Gurney said. “Many countries are unwilling to sign a treaty when greenhouse gas emission reductions cannot be independently verified.”
In the short term, the platform is an intriguing picture of our current contribution to climate change. In the long term, it could be a step towards reducing those contributions. ”Hestia offers practical information we can use to identify the most cost-effective ways to reduce emissions and track progress over time,” Gurney said. “Scientists have spent decades describing the seriousness of climate change. Now, we are offering practical information to help do something about it.”
/https://tf-cmsv2-smithsonianmag-media.s3.amazonaws.com/accounts/headshot/joseph-stromberg-240.jpg)