Explore the Secret Lives of Animals With These Marvelous Maps
A new book considers how sophisticated tracking technology and the data it collects can improve conservation strategies
/https://tf-cmsv2-smithsonianmag-media.s3.amazonaws.com/accounts/headshot/Wei-Haas_Maya_Headshot-v2.png)
:focal(1318x496:1319x497)/https://tf-cmsv2-smithsonianmag-media.s3.amazonaws.com/filer/e4/f1/e4f11f61-3b86-4ad6-b32f-9d088a2aba58/wheretheanimalsgo_seaturtles1.jpg)
/https://tf-cmsv2-smithsonianmag-media.s3.amazonaws.com/filer/a5/a8/a5a874b8-2c9e-4252-bccf-31361bf2f90d/wheretheanimalsgo_globalhunt.jpg)
/https://tf-cmsv2-smithsonianmag-media.s3.amazonaws.com/filer/94/4d/944df89f-b14f-4cb2-b47b-4f6f898e3fe9/wheretheanimalsgo_mountainlions2.jpg)
/https://tf-cmsv2-smithsonianmag-media.s3.amazonaws.com/filer/eb/cd/ebcd1827-a26a-4a23-9bb6-2dcc611c794f/wheretheanimalsgo_albatrosses1.jpg)
/https://tf-cmsv2-smithsonianmag-media.s3.amazonaws.com/filer/bf/16/bf16ff06-2ab5-4fe3-a384-ec37e362e48b/wheretheanimalsgoseaturtles3.jpg)
Tens of thousands of dots speckle the map's surface, each marking the death of a whale. Bowheads, right whales, humpbacks and more dapple the miles of ocean.
The map is among the earliest data scientists have on the distribution and migration of whales. But researchers didn’t collect the 53,877 data points. Rather 18th and 19th century whalers scoured the oceans for the massive beasts, who were valued for their meat and blubber, and noted each kill in ship logbooks. In the 1930s, American zoologist Charles Townsend recognized the significance of these records, compiling the locations in a series of charts that provided the first big picture look at these creatures under siege.
The map of killed whales does more than tug at the heartstrings. "It shows how far we've come," says graphic designer Oliver Uberti, co-author of the new book, Where the Animals Go, which uses maps and graphics to give readers a peek into the secret lives of animals that traverse the globe.
The whaling map is just one of 50 beautifully detailed illustrations that grace the pages of the book. Each map helps the readers to walk, swim or fly in the paths of wild animals—their myriad routes around the globe reflected in scribbles and tangles across the page. Most of the maps focus on recent research and cutting-edge tracking methods—GPS tags attached to turtle shells; barcode-like keys affixed to the backs of ants; "in-flight recorders" to measure the location, pressure, speed and acceleration of vultures; even fluorescent nanoparticles used to track the movements of plankton.
But the book also features several historical maps, including the one that uses Townsend's repurposed whale data, to demonstrate just how much technology has transformed animal tracking and will continue to influence the way we think about and protect animals—from ants to owls to elephants.

In the case of whales, the earliest "tags" took the form of harpoons, says Uberti. Researchers would engrave these weapons with unique identifiers and their address, driving them into animals spotted at sea. They would then offer a reward to whalers who returned the tags. This would give essentially two data points per animal: one when it was tagged, another when it was killed.
Nowadays, technological advances allow scientists to track animals in a nonlethal manner while obtaining a stunning amount data. "Filling in those [data] gaps is [helping] researchers view animals on the individual level in unprecedented detail," says James Cheshire, a geographer from the University College of London, who co-authored the book with Uberti. The duo explores a range of examples in Where the Animals Go. Scientists get cell phone alerts from the collars of elephants in Kenya. They can watch in almost real time as a wolf traverses the Alps, and they can even track the movements of badgers by the second as they move about their burrows underground.
The idea for the book began with an elephant named Annie, who lived in the lands in and around Chad’s Zakouma National Park. In 2005, Uberti, then a designer for National Geographic, was invited to work on visualizations for a story about the devastating effects of poaching on elephant populations. In 1970 there were around 300,000 elephants in central Africa; by 2005, there were a mere 10,000.
National Geographic sent a team, including ecologist Mike Fay and photographer Michael Nichols, to Chad to document the remaining herds—how they traveled, where they went and what threatened them. To do this, explains Uberti, they used what was at the time relatively new technology: a GPS collar. The team followed Annie's every step for 12 weeks over 1,015 miles, mapping out a winding track through the savannah.
"On the map that we made, there's a point where Annie's track stops," Uberti says. "Annie was killed by poachers."
Working on that map changed the way Uberti thought about wild animals. "It was the first time a map—a piece of paper with an abstraction of an animal's life—connected me to the individual animal," he says.
Ten years later, Uberti and Cheshire were in search of a new project when Annie's story popped into Uberti's mind. He recalls thinking: "What if we could gather stories...to help people connect and be inspired by individual animals the way Annie inspired me?" And that's exactly what they did.
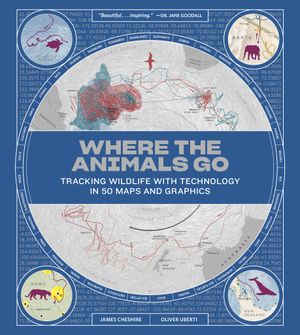
Where the Animals Go: Tracking Wildlife with Technology in 50 Maps and Graphics
For thousands of years, tracking animals meant following footprints. Now satellites, drones, camera traps, and more reveal the natural world as never before. Where the Animals Go is the first book to offer a comprehensive, data-driven portrait of how creatures like ants, otters, owls, turtles, and sharks navigate the world.
The pair sought out researchers who were willing to share their work and help them comb through the details. But gathering and translating the data was no small task. These days tracking tags are getting smaller, more responsive, and last longer than ever, Cheshire explains. And that means thousands or even millions of data points.
"If you've got hundreds of seals going around Antarctica, all their tracks over a number of months create this great tangle of squiggly lines. It's a pretty indecipherable hairball," says Uberti. "What we tried to do in the book was clean out that hairball and extract one or two hairs—one or two individuals."
They also combined each individual's ventures with all the useful background data they could find. Swirling blue currents pirouette throughout the seas on a map tracking the travels of turtles. A spidery network of fractures spread through the surface of a frozen lake on a map of snowy owl escapades. The book took two years to assemble from start to finish. But through this grueling process, a narrative slowly emerged from the numbers.
There's the tale of the gulls who had a mysterious habit of visiting Mouscron, France, a city some 40 miles away from their breeding grounds. It turns out, they were heading to a chip factory, feasting on the smorgasbord of discarded crunchy potato goodness.
Then there's the story of the mountain lions of southern California, who are essentially "marooned on an island" from the encroaching human development, the authors write. Surrounded by freeways and cities, the lion's shrunken habitat is limiting their gene pool. Though the California Department of Transportation created a supposed corridor for the big cats, it wasn't designed with the creatures in mind, write Uberti and Cheshire. Few cats use the paved, open pathway.
Though many of the stories show the impact of humans on animal populations, others demonstrate the ingenuity of the creatures. One example is the story of Fisher the loggerhead turtle. Biologists from the North Carolina Aquarium found him just off the coast in 1995, weak and underweight. So they took him in and helped him recover. He was released back into the wild nine years later, sporting a tag affixed to his shell by scientists from the University of Exeter. They watched in surprise as the turtle beelined it through the currents to the part of the ocean he should be at his age.
"It's kind of extraordinary that he has a map, a compass, and a timetable that he's working to," says Cheshire.
After reading the dynamic stories in the book, it's hard not to look at animals in a different way. Cheshire explains how he once didn't think much about the birds in his backyard. "You kind of assume they just hang out there all the time," he says. But that all changed after working on the maps of Where the Animals Go, he says. "We're able to add this backstory to the animals about where they've been, where they're going."
Each of the stories also illustrates researchers fighting to better understand wild animals and develop strategies for conservation that will make a difference. Governments often set specific "protected" regions on land and in the sea to help conserve animals, strictly delineated by imagined or true fence lines. But animals don't recognize such arbitrary boundaries.
"We have more information now than we've ever had before." says Uberti. Using this information, conservation strategies could be tailored to specific creatures, or protected areas could change in tune with the seasons as animals migrate around the globe.
This thread of conservation ties together the diverse tales and questions researchers ask throughout the book. As Uberti sums it up: "To protect animals you must protect where they go."
*All map images reprinted from Where the Animals Go: Tracking Wildlife with Technology in 50 Maps and Graphics by James Cheshire and Oliver Uberti. Copyright © 2017 by James Cheshire and Oliver Uberti. With permission of the publisher, W. W. Norton & Company, Inc. All rights reserved.
/https://tf-cmsv2-smithsonianmag-media.s3.amazonaws.com/accounts/headshot/Wei-Haas_Maya_Headshot-v2.png)