How Daily Images of the Entire Earth Will Change the Way We Look At It
With more satellites than any other company, Planet Labs gives environmental researchers daily data
/https://tf-cmsv2-smithsonianmag-media.s3.amazonaws.com/filer/d3/fb/d3fb245e-af07-4582-a75a-26920d28b16c/planet-deployment-flock.jpg)
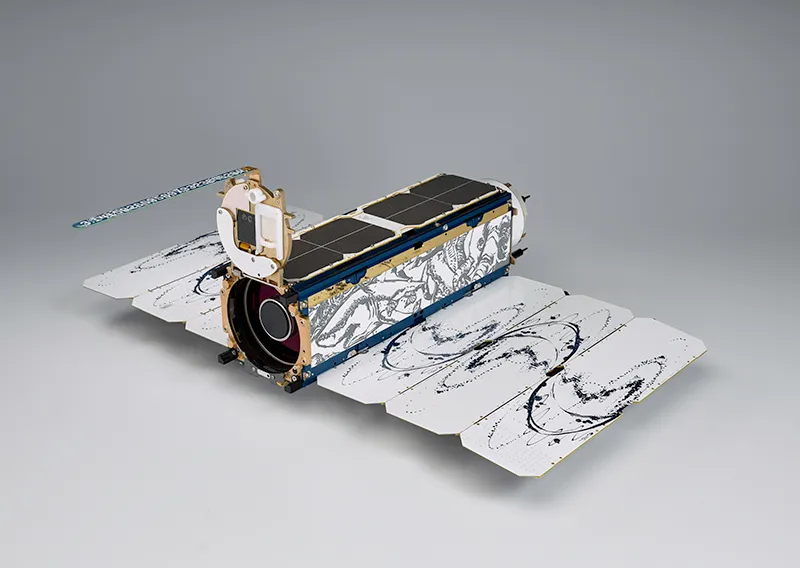
On February 14, a company called Planet Labs launched 88 small satellites. Combined with its preexisting satellites and the recent acquisition of satellite imaging company Terra Bella, this means it operates more satellites than any other company in the world.
Each unit is about the size of a loaf of bread, and includes a cylindrical gold telescope linked to a CCD image sensor (similar to the high-quality, low-noise sensors in high-end digital cameras), as well as equipment to beam 20-kilometer by 20-kilometer images to a network of ground stations.
With the increased capacity—the satellites, called Doves, are currently spreading around the Earth and deploying their solar panels—Planet will be able to achieve its original goal: imaging the entire land mass of the Earth every day.
“We really thought long and hard about all the problems of the world, and what is it that we could do using satellites to help those things, from feeding the hungry, to getting access for people to clean water to disaster response to stopping deforestation,” says Will Marshall, Planet co-founder and CEO. “Imaging the planet on a more regular basis, we believe, can significantly help many of those global challenges.”
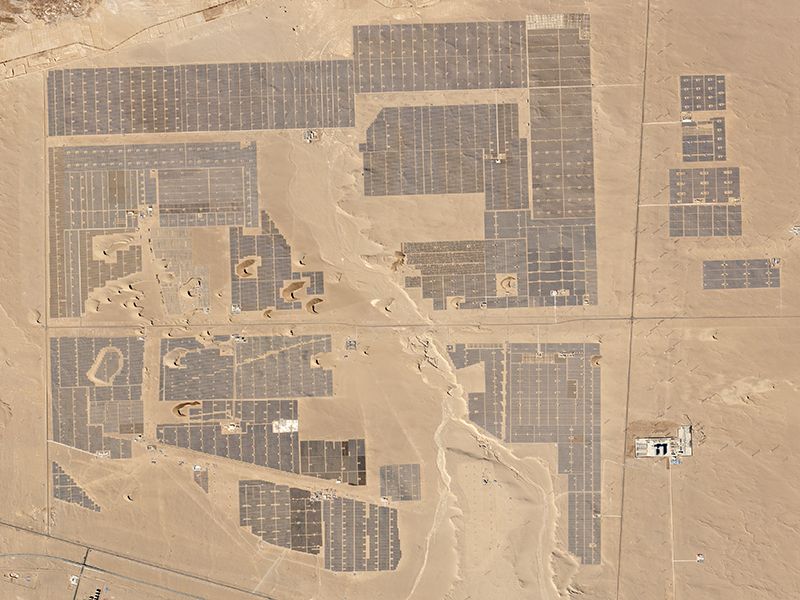
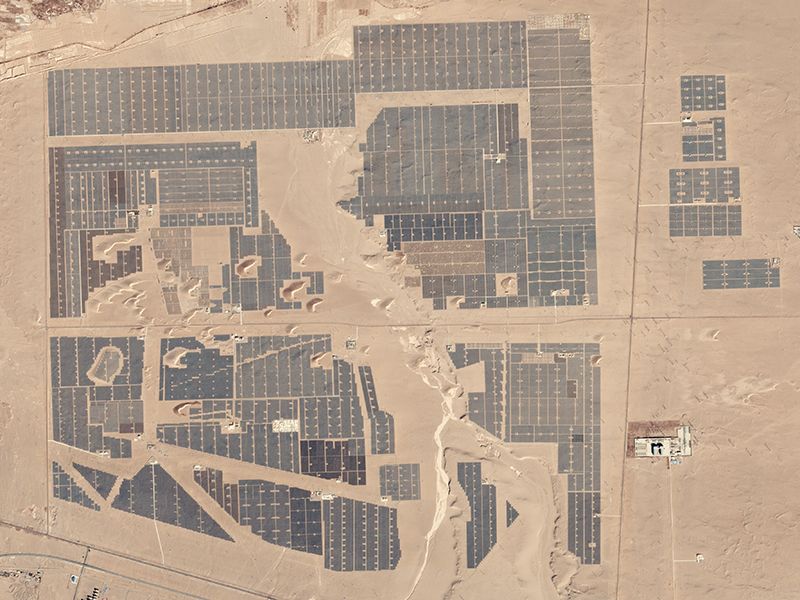
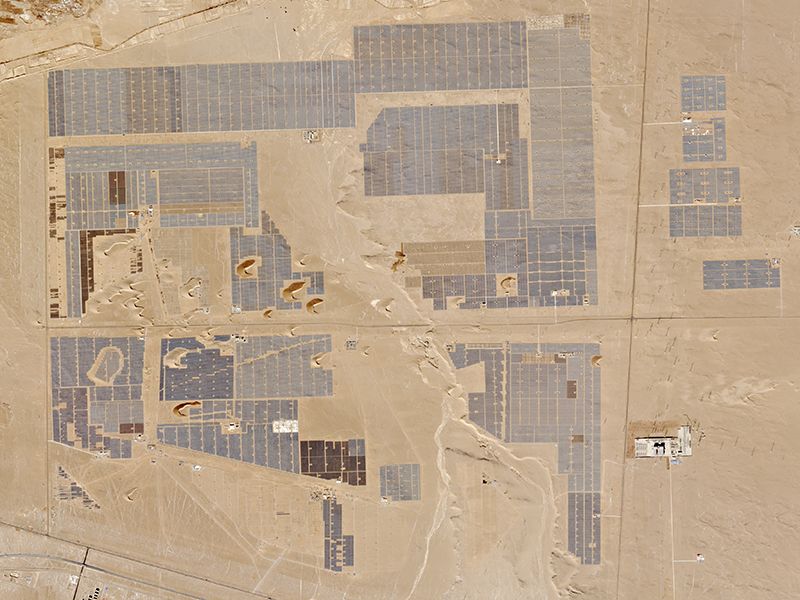
Planet sells access to their images to a variety of industries, from agricultural companies to consumer mapping companies to governments. The imagery is used to monitor agriculture and forests for management, and to plan intelligence and disaster response, but it has great potential in tackling environmental issues.
Marshall uses deforestation as an example: Satellite data can tell us where it’s occurring, and how much, but current imaging only occurs in sufficient detail every few years. “You can wake up at the end of those few years and there’s a bloody great hole in the Amazon,” he says. “That’s good to know, but it’s too late to do anything about it.”
So Planet initiated its ambassador program, which makes images available for free to researchers who use it for academic projects.
“A critical missing link between sustainability outcomes and getting towards more sustainable finance or a more sustainable global economy is better data, around what’s actually happening,” says Tara O’Shea, an impact analyst at Planet. “How do you quantify it? How do you translate environmental research into actual tools?”
Currently, the program provides data to approximately 160 researchers, in various ecological and even humanitarian fields. Here are three, who each use similar information—TIFF files of medium-resolution images of the Earth—in different ways.
Shootout at the OK Coral
Greg Asner is a professor of earth system science at Stanford’s Carnegie Institution for Science. Normally, he flies around in a mobile lab aboard a Dornier Do 228 plane called the Carnegie Airborne Observatory, using detailed imaging techniques to acquire data about the biodiversity below him—what species, and how many, live in an area. While Planet’s data can’t directly assess biodiversity, it allows him to choose areas to focus on. The daily info from the Doves gives him a strategic view, and the observatory fills in the details.
“If you can look anywhere on the planet every day, where do you want to put your emphasis in terms of conservation science?” says Asner. “Places that can change fast, that’s really the answer.”
He found a great example in the Spratly Islands, a collection of coral atolls in the South China Sea. As seawaters warm, corals are dying out, in a process called bleaching. Using images from Planet, Asner identified the atolls, and then dove in for a closer look. Instead of hovering above in the plane, he performed underwater surveys of the coral, to see if the satellite data gave indications of the basic health of the reefs, and is publishing the results in the journal Remote Sensing in Ecology and Conservation.
“We proved that the planet data can see not only where these atolls are, but how much coral reef they have,” Asner says.
It turns out that the coral of the Spratly Islands is relatively healthy, in comparison to reefs around the world, making it an ideal target for protection. But the islands are uniquely at risk, too—the South China Sea is a contentious area attracting military power from around the region. “It’s ironic, sad and disconcerting, that all these militaries are now operating in there, and destroying these reefs by hand,” he says.
Glacial Pace
Andreas Kääb is a geoscience professor at the University of Oslo who measures the rate of flow of glaciers in Patagonia, New Zealand, Alaska, the Himalayas, and other locations. Glaciers relate to climate change, and impact sea level on a global scale. But their rate of flow can also have a huge effect locally, on downstream ecosystems and communities, as meltwater lakes grow, get stopped up by ice, and burst.
Daily images allow Kääb to track the glaciers by measuring the movement of crevasses and other visible features on their surface. He runs that through data analysis to compare the rates of different glaciers and predict which will be more affected by temperature changes. “The goal then is to early forecast, [or] recognize which glacier could be a problem,” he says.
In 2016, in the Karakoram region on the India-Pakistan border, Kääb detected an unusually fast glacier, traveling several meters per day, and watched as it crossed a river and stopped it up. Over the course of weeks, the water built up behind the glacier, until the ice floated up on top of the water, and the river broke free.
There was property damage, but nobody was hurt. Such information could easily be used to develop an early warning system for such floods around the world.
“The high repeat rate of planet data is very important,” he says. “If you get this information only every second week … we might miss the important changes.”
Field Studies
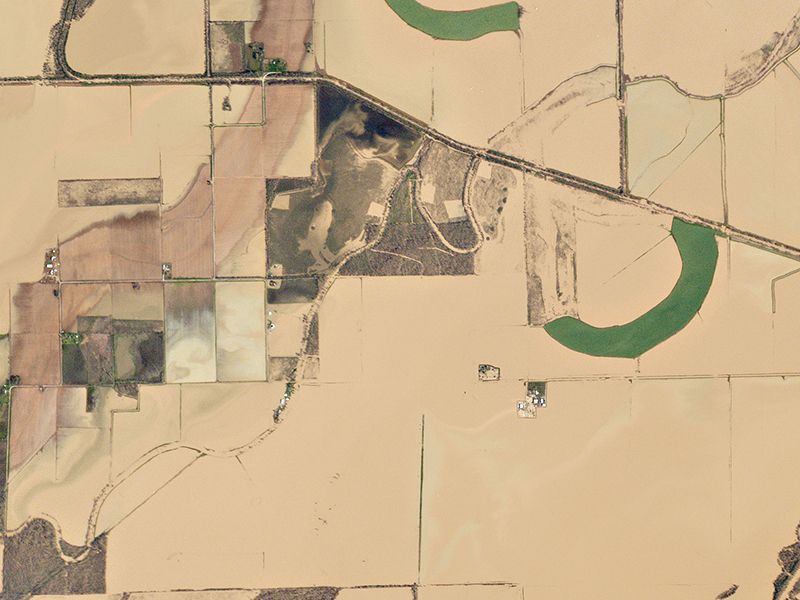
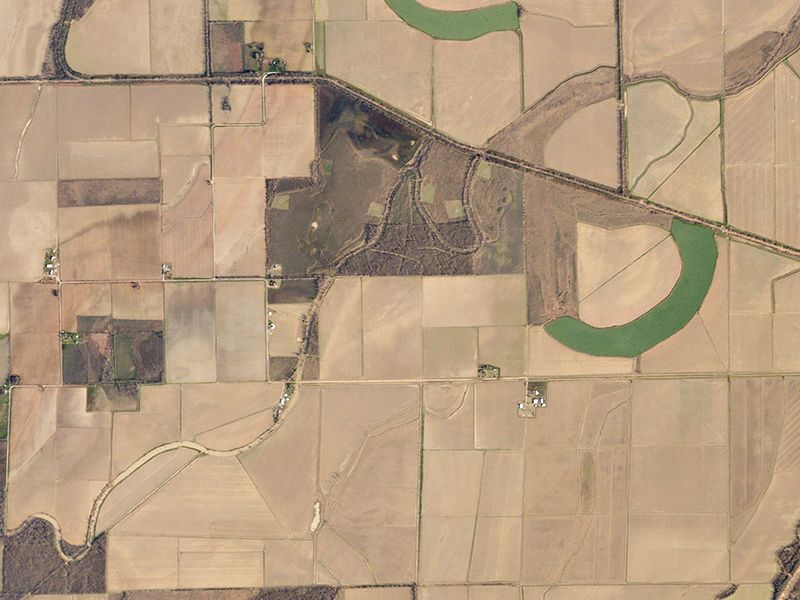
Meha Jain, an assistant professor of environmental informatics and justice at the University of Michigan, studies the impacts of environmental changes on small farms—two hectares or smaller—in India. At this scale, data from Planet allows her to spot individual farm fields. Colleagues at Stanford have created a simulation that compares the data to vegetation indices, and Jain uses those indices to track production.
Meanwhile CIMMYT, the International Maize and Wheat Improvement Center, has been offering farmers in India a fertilizer-spreading device that distributes material more evenly than traditional hand-strewn methods. “We’re using satellite data to map yields through time and see if we can pick up the impacts of these interventions from space,” says Jain.
Over the past two years, Jain has evaluated 200 fields in the Northeast-India state of Bihar, half of which were fertilized by the new method, half by hand. So far, Jain’s work has revealed a 7 to 10 percent yield advantage when the spreader is used.
“Agriculture is a primary source of livelihood for about 70 percent of India’s rural population, so any sort of increases in production that we can have aren’t only a matter of food security, but also a matter of welfare,” she says.