Five Unusual Ways Scientists Are Studying Climate Change
Fossilized urine, old naval logbooks and the recent speeds of satellites are among the unexpected records that track changing climate
/https://tf-cmsv2-smithsonianmag-media.s3.amazonaws.com/accounts/headshot/joseph-stromberg-240.jpg)
/https://tf-cmsv2-smithsonianmag-media.s3.amazonaws.com/filer/20130823085213earth-copy.jpg)
The effects of climate change can be seen everywhere. It’s melting Antarctica’s ice sheets, dooming major cities to future flooding, damaging coffee harvests and even changing the taste of apples.
This distressing situation nonetheless presents scientists with an opportunity. Because the climate change is so widespread, it can be studied by examining a tremendous range data. Many of these data are collected from satellite images, extracted through analyzing ice cores or found from sifting through atmospheric temperature records. But some are collected from a bit more unorthodox sources. In no particular order, here’s our rundown of 5 unusual ways scientists are currently studying the changing climate:

1. Fossilized Urine
The hyrax—a small, herbivorous mammal native to Africa and the Middle East—has a pair of uncommon habits. The animals tend to inhabit the same cracks in rock for generations, and they also like to urinate in the exact same spot, over and over and over again. Because their urine contains traces of leaves, grasses and pollen, the layers of dried urine that build up and fossilize over thousands of years have given a team of scientists (led by Brian Chase of Montpellier University) a rare look at ancient plant biodiversity and how it’s been affected by broader changes in climate.
Further, the nitrogen in the urine—an element that’s long been important to those who utilize the scientific properties of pee—along with the urine’s carbon content tell an important story as layer after layer of the dessicated substance, called hyraceum, is analyzed. In drier times, plants are forced to incorporate heavier isotopes of these elements into their tissues, so urine layers that contain an abundance of heavy isotopes indicate that the hyrax relieved themselves after ingesting relatively parched plants. Stacked layers of the excretions thus allow scientists to track humidity through time.
“Once we have found a good layer of solid urine, we dig out samples and remove them for study,” Chase told The Guardian in an article about his unusual work. “We are taking the piss, quite literally—and it is proving to be a highly effective way to study how climate changes have affected local environments.” His team’s most valuable data set? One particular pile of fossilized urine that has been accreting for an estimated 55,000 years.
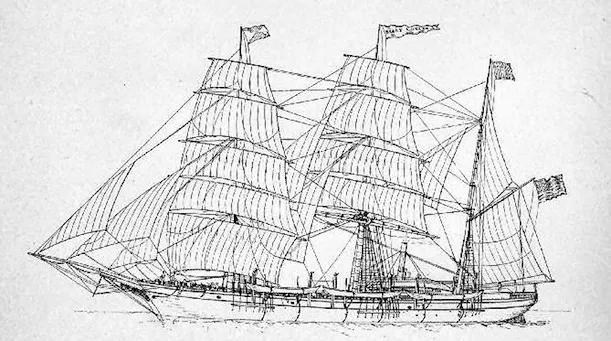
2. Old Naval Logbooks
Few people care more about the weather than sailors. Old Weather, a citizen science project, hopes to take advantage of that fact to better understand the daily weather of 100 years ago. As part of the project, anyone can create an account and manually transcribe the daily logbooks of 18th and 19th century vessels that sailed the Arctic and elsewhere.
The work is still in its beginning stages: So far, 26,717 pages of records from 17 different ships have been transcribed, with roughly 100,000 pages to go. Eventually, once enough data has been transcribed, scientists from around the world who are coordinating the project will use these ultra-detailed weather reports to paint a fuller picture of how microvariations in Arctic weather correspond with long-term climate trends.
Although there’s no pay offered, there’s the satisfaction of adding to our record on climate variations over the past few centuries. Plus, transcribe enough and you’ll get promoted from “cadet” to “lieutenant” to “captain.” Not bad for a modern day scrivener.
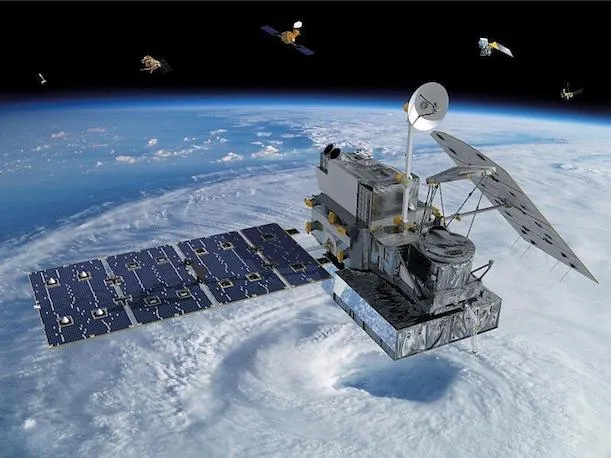
3. Satellite Speeds
Not long ago, a group of scientists who study how the atmosphere behaves at high altitudes noticed something strange about several satellites in orbit: They were consistently moving faster than calculations indicated they should. When they tried to figure out why, they discovered that the thermosphere—the uppermost layer of the atmosphere, starting roughly 50 miles up, through which many satellites glide—was slowly losing its thickness over time. Because the layer, made of up sparsely distributed gas molecules, was losing its bulk, the satellites were colliding with fewer molecules as they orbited and thus experienced less drag.
Why, though, was the thermosphere undergoing such change? It turned out that higher levels of carbon dioxide emitted at the surface were gradually drifting upwards into the thermosphere. At that altitude, the gas actually cools things down, because it absorbs energy from collisions with oxygen molecules and emits that stored energy into space as infrared radiation.
For years, scientists had assumed the carbon dioxide released from burning fossil fuels didn’t reach higher than about 20 miles above the Earth’s surface, but this research—the first to measure the concentrations of the gas this high up—showed that climate change can even affect our uppermost atmospheric layers. The group plans to look back and see how historical changes in satellite speeds might reflect carbon dioxide levels in the past. They will also continue to track satellite speeds and levels of carbon dioxide in the thermosphere to see how our aeronautical calculations might have to take climate change into account in the future.
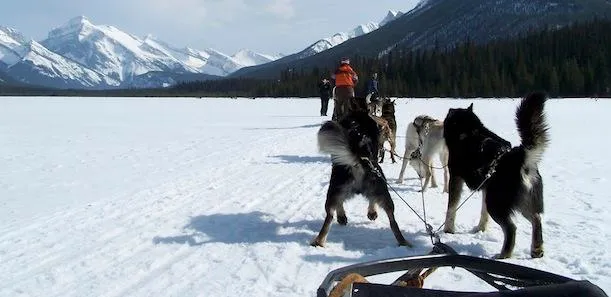
4. Dog Sleds
Unlike many sorts of climate data, information on sea ice thickness can’t be directly collected by satellites—scientists instead infer thicknesses from satellite measurements of the ice’s height above sea level and a rough approximation of ice’s density. But getting true measurements of sea ice thicknesses must be done manually with sensors that send magnetic fields through the ice and pick up signals from the water below it—the fainter the signals, the thicker the ice. So our knowledge of real ice thicknesses is constrained to the locations where researchers have actually visited.
In 2008, when Scottish researcher Jeremy Wilkinson first traveled to Greenland to collect such measurements on ice thickness, his team interviewed dozens of local Inuit people who spoke about the difficulties thinner sea ice posed for their traditional mode of transportation, the dog sled. Soon afterward, Wilkinson got an idea. ”We saw the large number of dog teams that were on the ice everyday and the vast distances they covered. Then came the light bulb moment—why don’t we put sensors on these sleds?” he told NBC in 2011 when the idea was finally implemented.
Since then, his team has attached the sensors to the sleds owned by a few dozen volunteers. As the Inuits glide over the sea ice on their sleds, the instruments take a measurement of the ice’s thickness every second. His team has now deployed the sled-mounted sensors in each of the last three years to collect the data. The information collected not only helps scientists gauge the accuracy of thicknesses derived from orbiting satellites, but also helps climate scientists better understand how sea ice is locally responding to warmer temperatures as seasons and years change.
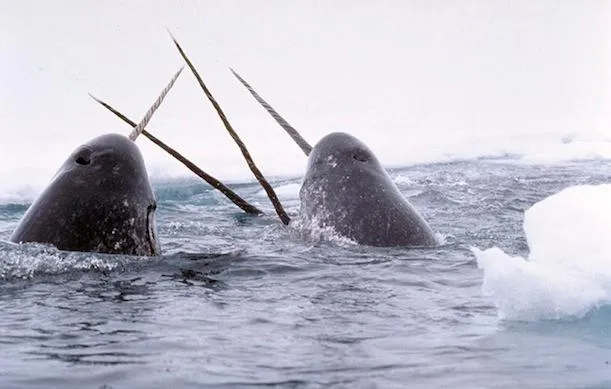
5. Narwhal-Mounted Sensors
Narwhals are renowned for their ability to dive to extreme depths: They’ve been measured going as far as 5,800 feet down, among the deepest dives of any marine mammal. Starting in 2006, NOAA researchers have used this ability to their advantage, by strapping sensors that measure temperature and depth to the animals and using the data to track Arctic water temperatures over time.
The strategy gives scientists access to areas of the Arctic ocean that are normally covered by ice during the winter—because the Narwhals’ dives, which can last as long as 25 minutes, often take them under areas of the water that are frozen on top—and is much less expensive than equipping a full icebreaker ship and crew to take measurements. Before using narwhals, temperatures of the Arctic waters at remote depths were inferred from long-term historical averages. Using the unorthodox method has helped NOAA document how these historical averages have underrepresented the extent to which Arctic waters are warming, particularly in Baffin Bay, the body of water between Greenland and Canada.
/https://tf-cmsv2-smithsonianmag-media.s3.amazonaws.com/accounts/headshot/joseph-stromberg-240.jpg)