Land Around the Infamous San Andreas Fault Is on the Move
Scientists mapped how California rises and falls around its most famous fault
/https://tf-cmsv2-smithsonianmag-media.s3.amazonaws.com/accounts/headshot/erin.png)
:focal(1102x770:1103x771)/https://tf-cmsv2-smithsonianmag-media.s3.amazonaws.com/filer/dd/af/ddaf1385-749e-4f28-89f0-128218026293/15637523202_bbdcf11b2c_k.jpg)
The San Andreas fault is almost synonymous with California—after all, the spot marks the boundary between the Pacific Plate and the North American plate that defines the state’s geography. And then there’s the chance of a catastrophic earthquake that could one day rip down the gash in the Earth, wreaking havoc in some of the United States’ most populous areas. But surprisingly, it’s been hard for researchers to figure out just how the fault is affecting California over time. Until now: As Rong-Gong Lin II writes for The Los Angeles Times, researchers have produced the first computer image that shows how California is rising and falling around the fault.
The study, which was published this week in the journal Nature Geoscience, found large-scale motion in the fault that had not previously been documented. Researchers used a GPS array installed along the fault by the Plate Boundary Observatory. Since GPS can measure both horizontal and vertical motion, it’s being used to create a 3D picture of what’s up along the fault.
But GPS has a downside: Since it provides such a complete picture, it can be hard for researchers to separate useful, regional data from small-scale motion. Vertical motion, the scientists write, is “enigmatic” and muddles the signals from long-term changes along the fault. The vertical motion can come from many activities. For example, geologists know that human activity like irrigation, which drains water from land around the fault, is causing the ground around the fault to rise.
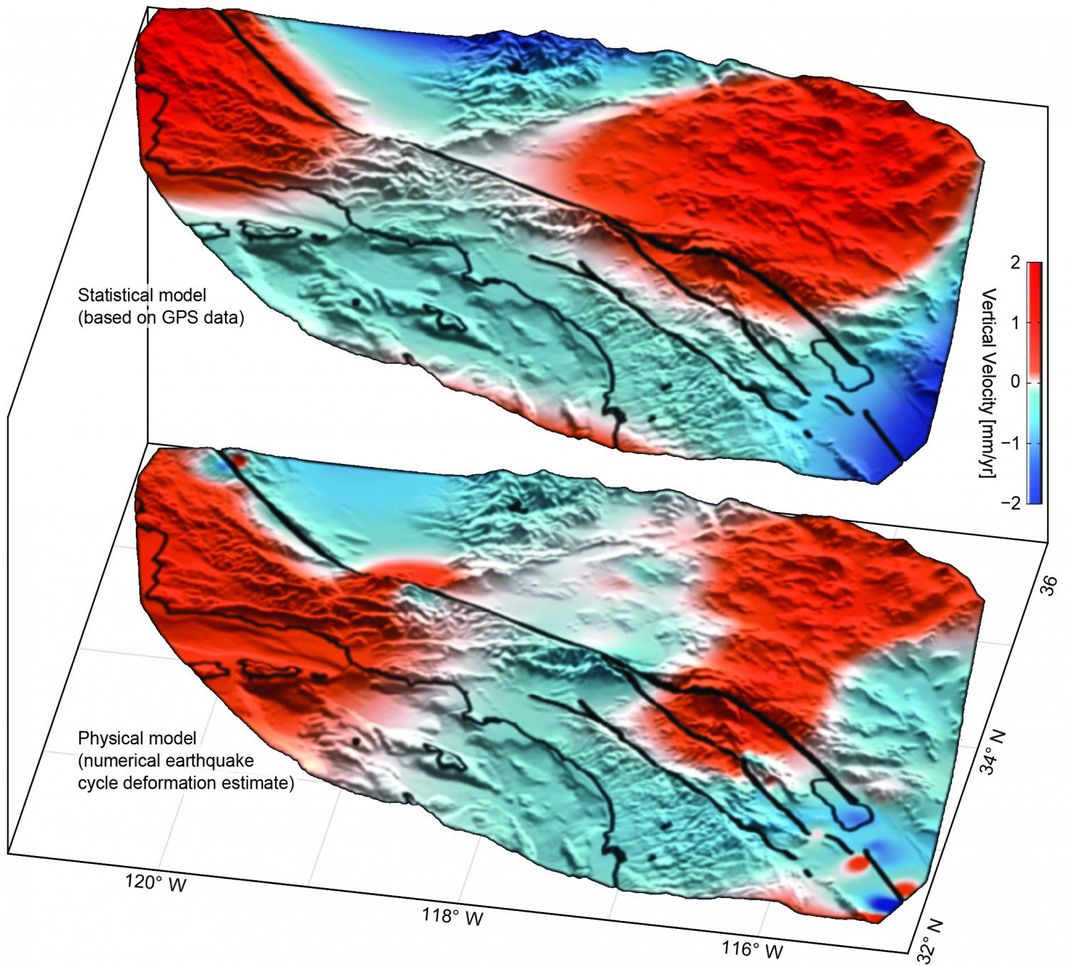
To tease out the important info, researchers sifted through GPS data and created a statistical model that separated out irrelevant vertical shifts. The analysis revealed that large swaths of the land around the fault is rising and falling. The pattern is different in different parts of California: In Los Angeles and San Diego, for example, land is sinking up to 0.11 inches per year. It’s rising at the same rate, however, in places like Santa Barbara and San Bernadino. Meanwhile, land right along the fault stays in the same place, and “when the next big earthquake strikes, the different parts of Southern California will lurch back to the same level,” writes Lin.
The data won’t help scientists predict just when a quake will strike along the San Andreas Fault—the most recent rupture forecast says there’s about a seven percent change that an earthquake higher than a magnitude 8 will strike within the next 30 years. But it never hurts to know as much as possible about the fault that defines an entire state and could one day decide its geological fate.
/https://tf-cmsv2-smithsonianmag-media.s3.amazonaws.com/accounts/headshot/erin.png)