NASA Can See Your Holiday Lights From Space
Scientists can use holiday lights during Christmas and Rammadan as a proxy for overall energy use in urban areas
/https://tf-cmsv2-smithsonianmag-media.s3.amazonaws.com/accounts/headshot/Screen_Shot_2014-01-27_at_12.05.16_PM.png)
/https://tf-cmsv2-smithsonianmag-media.s3.amazonaws.com/filer/72/45/72450d7a-ce4f-4d0c-951a-11087bdeb99a/2099797444_39929fd044_b.jpg)
It’s that time of year when ambitious homeowners take to their lawns and roofs to outdo their neighbors in a game of who can overwhelm the local power grid first. Results may vary from lonely candy canes to full-blown holiday light dragons. But whether you go full-throttle or prefer a low-key display of holiday cheer, one thing is now true: NASA is watching.
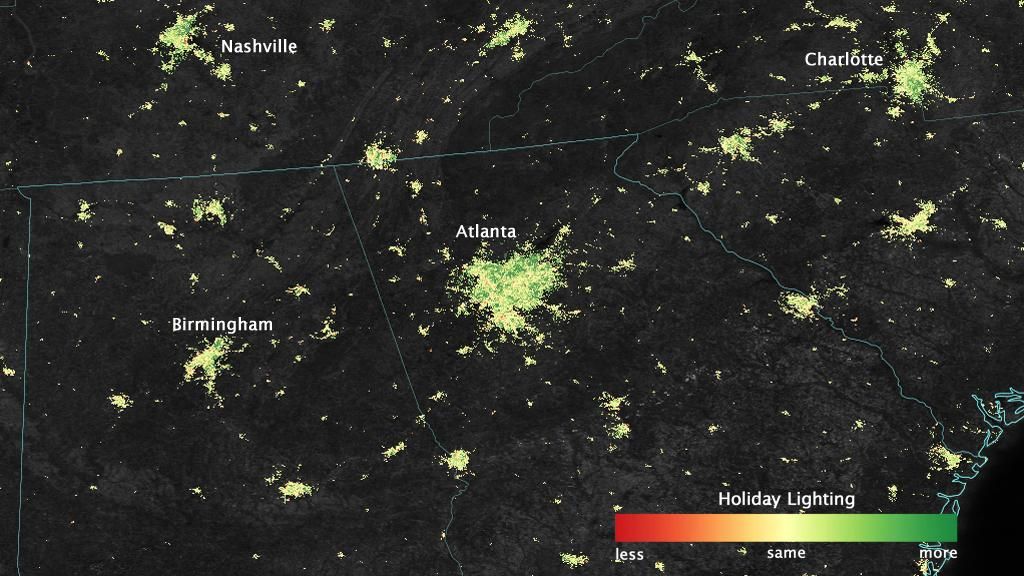
Scientists at the Goddard Space Flight Center in Maryland and Yale University in Connecticut used satellite imagery to track light patterns in 1,200 cities over two and a half years. They found that increased light correlated perfectly with the holiday seasons for Ramadan in the Middle East, as well as Christmas and New Year's Eve worldwide. They also saw variations in how cities and neighborhoods within those cities celebrate these holidays, the team announced this week at the American Geophysical Union's annual meeting in San Francisco.
"What’s happening during the holidays is our patterns are changing," says Miguel Román, a physical scientist at NASA Goddard. In the West, we're staying up late drinking eggnog and going home from work early. "Those changes in behavior are changes in the locations of demand for energy services." Understanding such seasonal shifts might ultimately tell us what's driving carbon emissions at a local level.
/https://tf-cmsv2-smithsonianmag-media.s3.amazonaws.com/filer/73/2f/732fc841-fe6c-4b68-842c-f05c6befddb7/sc_lv_phx.jpg)
With hundreds of satellites circling Earth, it might seem easy to snap a picture of exactly what’s down below. But getting really high resolution images has been difficult, especially when homing in on urban environments. In 2011, the Suomi-NPP satellite launched with a fancy schmancy camera aboard. This particular camera has low-light sensors that can pick up on wavelengths from green to infrared and create more intense images. The camera allows Suomi-NPP to take pictures of Earth at around 1am local time every night at very high resolution.
“It’s extremely sensitive. Allowing every single pixel to be overexposed, we can pick the faintest signal like a fishing boat out of the coast of Somalia, as well as very bright signals like volcanic magma on the Big Island of Hawaii,” explains Román.
In 2012, NOAA used the camera to make a composite image of a few months worth of lights at night. To make an image like that, you have to run the raw data through special algorithms, to correct for white noise such as fires, reflective aerosols and moonlight. NASA wanted to be able to do this on a daily basis, so Román started exploring options. To get a baseline, he looked at rural areas with little light pollution and at deserts. But when he took some initial data for Egypt and the Sahara, something looked weird, as if the lights were overly saturated.
“This was happening in urban areas, so we looked into that, and what we realized was that what we were seeing was that the increase in the signal was timing perfectly with the Ramadan calendar,” recalls Román. He emailed urbanization specialists at Yale, and they were intrigued. Sure enough, they found the same spike the next year. Over the next two and half years, the team measured data for three holiday periods: three years of Ramadan in the summer (in this case) and two years of Christmas plus New Years from the week of Thanksgiving to the first week in January. Running the images through a specially designed algorithm, they compared the light signal during these periods to the rest of the year in three geographic areas: the Middle East, North America and the Caribbean.
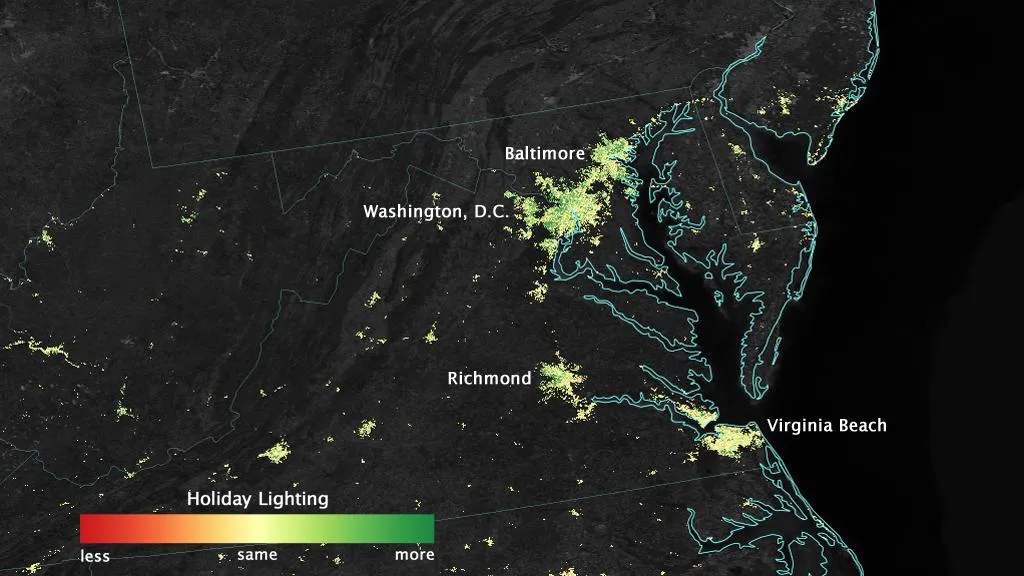
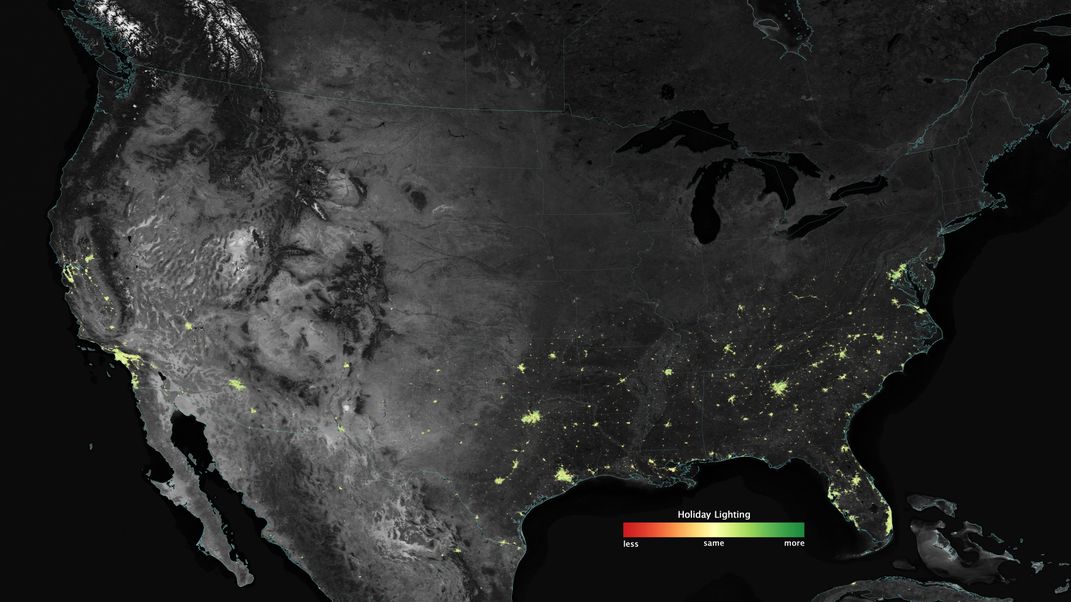
Snow turned out to be a big problem. Looking at the first round of Christmas data from the central U.S., Román saw a huge spike in Denver in 2012. But it wasn't just Christmas lights, it was lamp light reflecting off fresh snow, so they had to take out most cities north of St. Louis. Still, they were able to pick up on some general trends, and produced maps for the holiday periods.
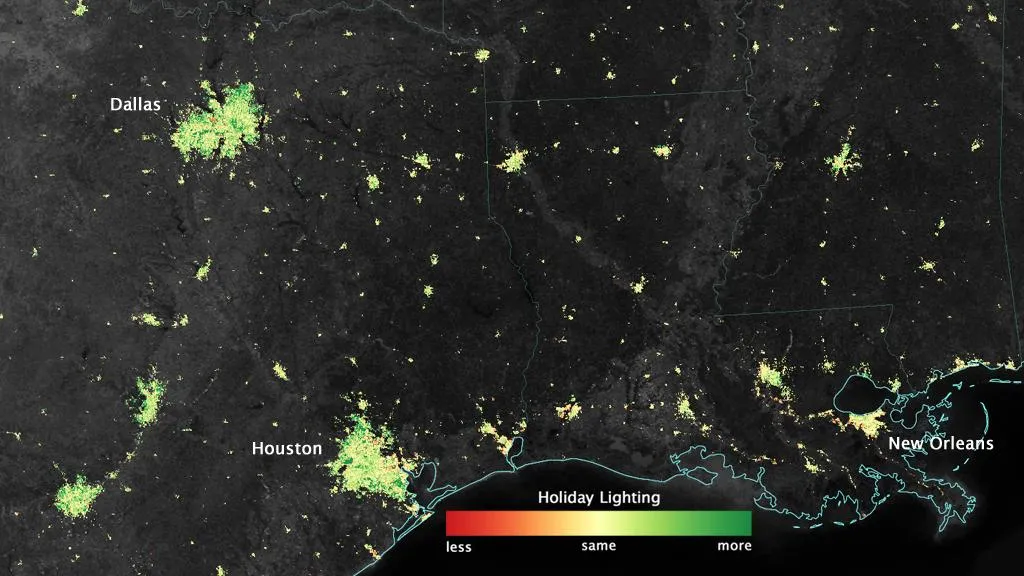
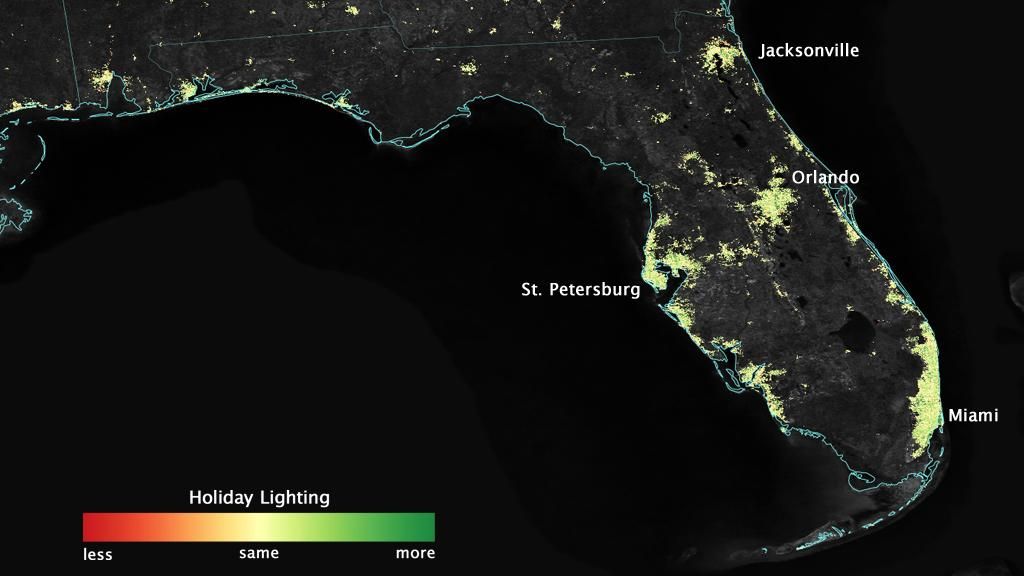
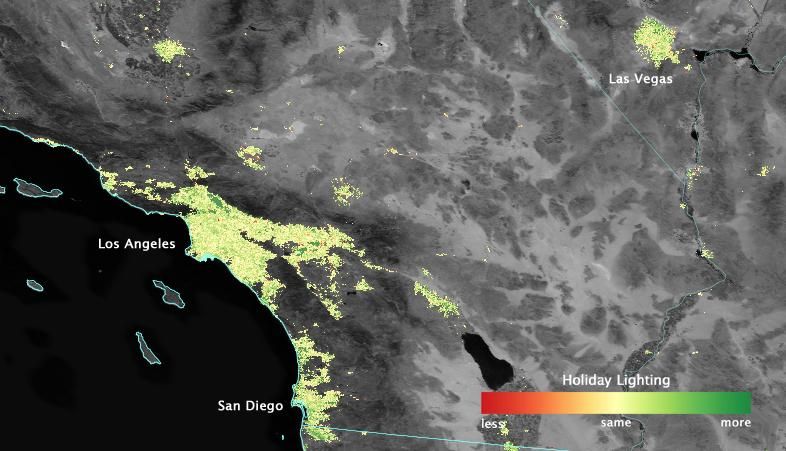
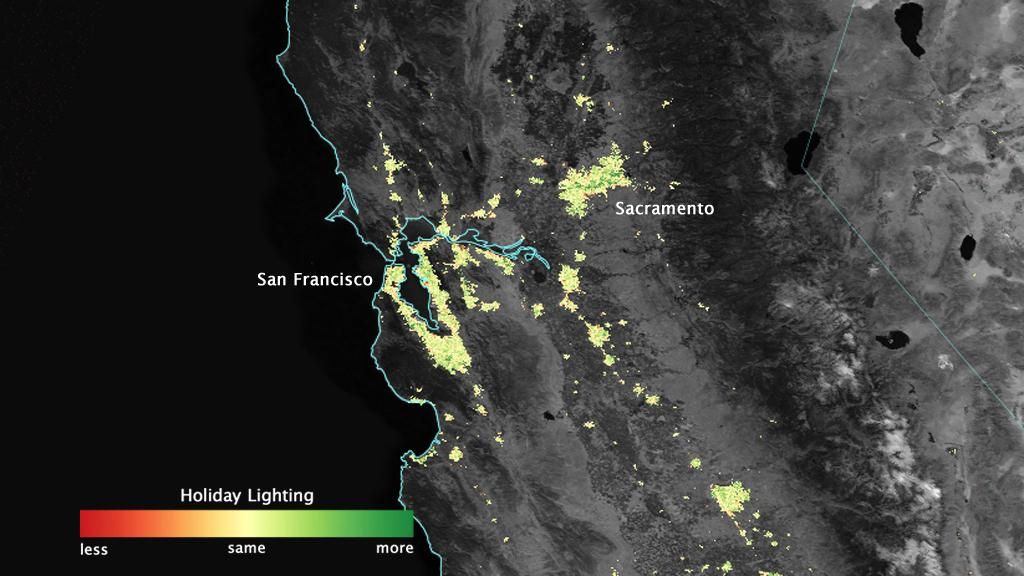
In 70 cities across the U.S., lights twinkled brighter during Christmas and New Year's, regardless of economic or other factors. "[It's] tracking this national shared tradition,"says Román. City suburbs in particular showed a 30 to 50 percent increase in lighting intensity, while most urban centers saw a 20 to 30 percent increase. That's likely because a bigger yard means more space for blow-up Santas and glow-in-the-dark reindeer.
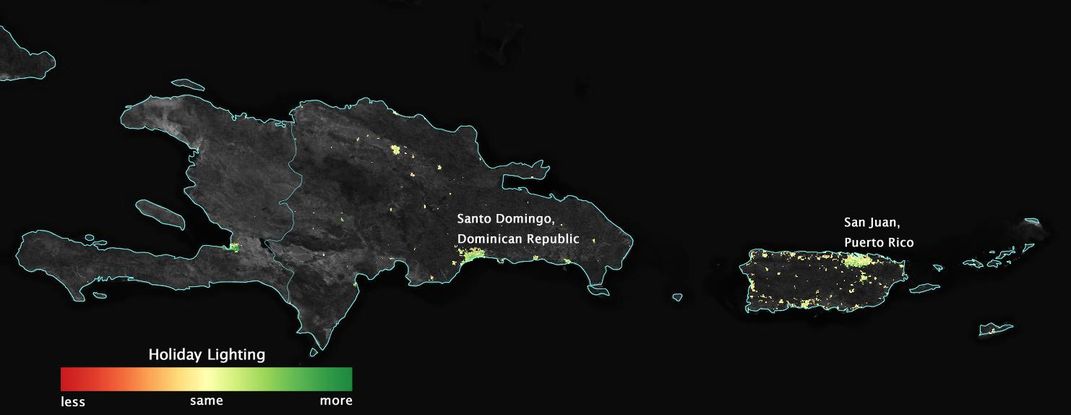
In Román's native Puerto Rico, the Christmas pattern emerged as well. Using their algorithm, the researchers were actually able to group together cultural centers of holiday festivals, industrial cities and more rural towns based on the citizens' energy habits. "[We] are now able to classify cities as a function of the energy behaviors of its inhabitants. Behaviors that are based on the norms, on the identities of a culture," explains Román. "This is way cooler than seeing Christmas lights from space."
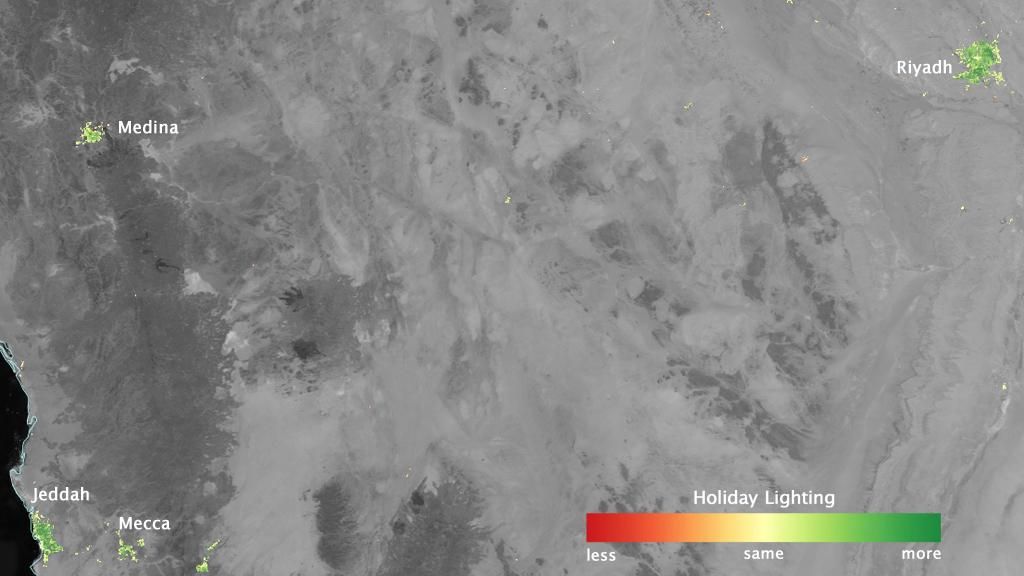
In the Middle East, the lights of major cities burned brighter during the holy month of Ramadan, typically culminating with a peak associated with Eid festivities. Generally, lights increased in the city center with group prayer activities at night and people going to work earlier.
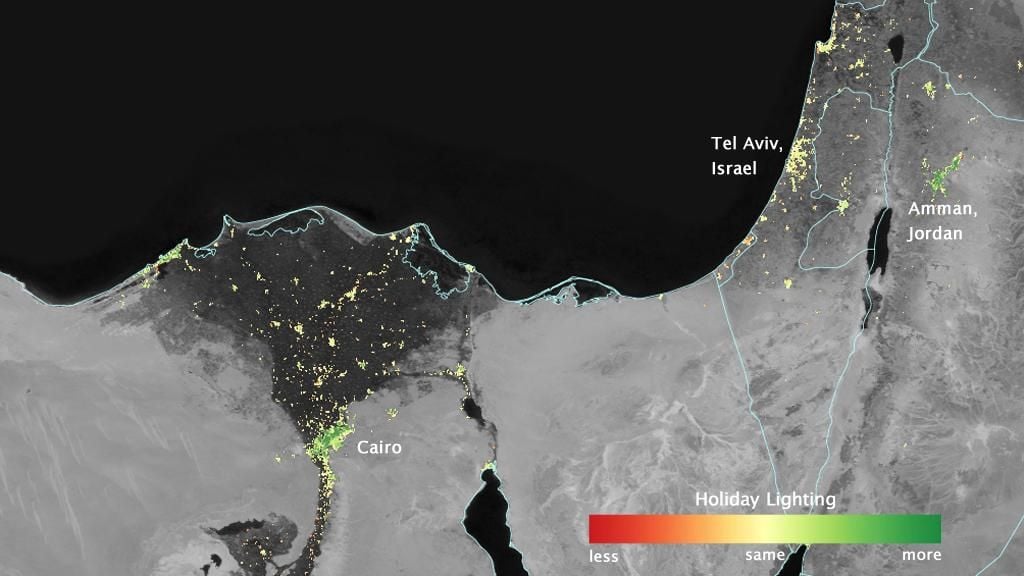
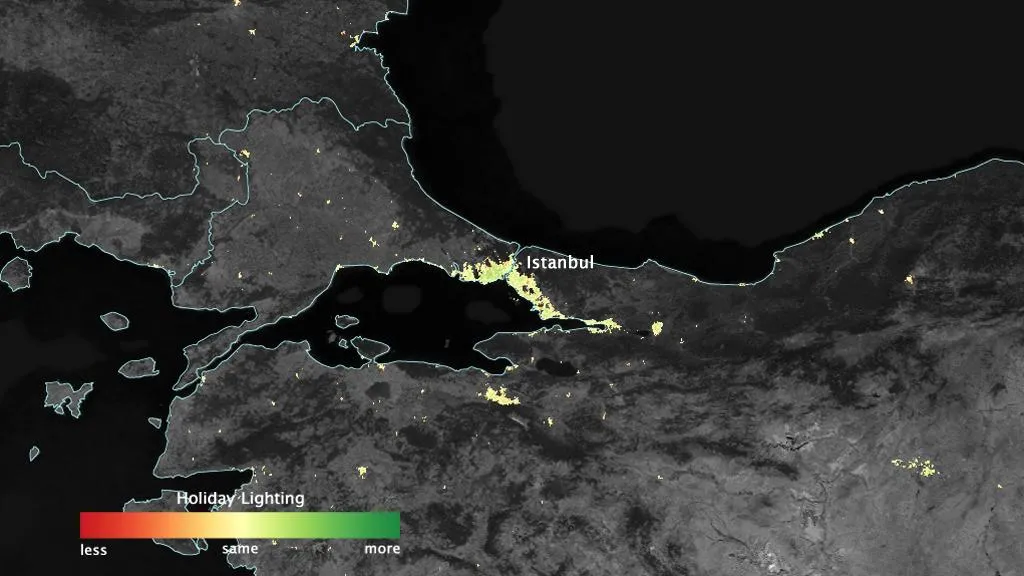
Differences across countries stood out. Saudi Arabia had the most intense Ramadan increase, while the lights of Istanbul were a little weaker. Saudi Arabia is more conservative, while Turkey is more secular. "Nighttime lights really track the cultural differences between these cities and the countries that host them," says Eleanor Stokes, a graduate student at Yale who collaborated on the study. Tel Aviv, notably, had no increase in lighting during the Muslim holy month. And cities in Iraq and Lebanon saw dips in nightime lights, which the researchers link to unreliable electricity. In Syria, decreases in nighttime light in Aleppo and Damascus likely corresponded to political and military unrest. "These nighttime lights really are in some ways like the EKG of a city," says Stokes.
In Egypt, the researchers took a closer look at 20 Cairo neighborhoods and found that poorer areas saw a smaller peak during Ramadan, choosing to leave the lights off for financial or maybe cultural reasons. "You can see those social and cultural imprints in the energy signatures themselves," says Stokes.
The data don’t give them an exact measure of the total energy use on a city block, but the lights do provide a proxy for tracking energy use patterns. “This is the factor that’s most sensitive to human behavior. When people turn on the lights, the next thing they’re going to turn on is the toaster and the heater,” says Román. “It’s those patterns of behavior that we’re trying to see.”
Urban areas account for a huge chunk of energy use and emissions, so the researchers hope to overlay the data with carbon emissions and energy consumption data in the future. "Carbon dioxide emissions is giving you the when, where and the how much. But it’s not telling you what is driving it," says Román. Looking at the lighting data against emissions could help build more localized climate mitigation strategies. Román points out: "What's going to work in New York City isn't necessarily going to work for Amarillo, Texas."
In this way, the images provide a lot more than pretty pictures of Earth from space.

Note: This article has been updated to reflect the fact that there are no active vocanoes on Kauai.
/https://tf-cmsv2-smithsonianmag-media.s3.amazonaws.com/accounts/headshot/Screen_Shot_2014-01-27_at_12.05.16_PM.png)