Google Street View Cars Are Mapping City Air Pollution
Google, Aclima and the EPA team up to add sensors to cars, first in Denver and then in the Bay Area, that monitor air quality throughout the day
/https://tf-cmsv2-smithsonianmag-media.s3.amazonaws.com/accounts/headshot/DSC_0196_2.JPG)
/https://tf-cmsv2-smithsonianmag-media.s3.amazonaws.com/filer/52/b2/52b2383f-1976-4dde-99a5-563a1a4cb920/aclimamapofdenver1.png)
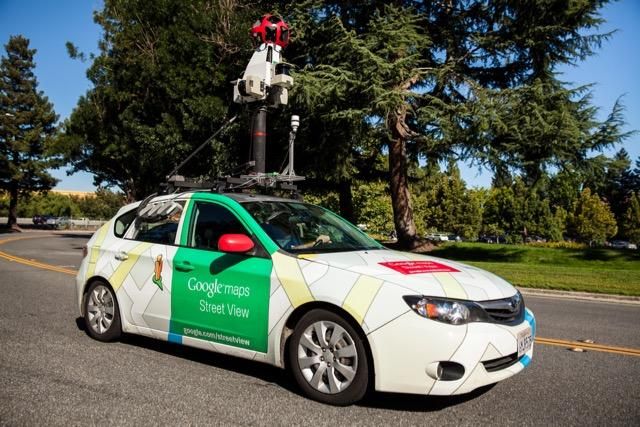
In one month, three Google Street View cars clocked 750 hours of drive time in Denver. But the cars weren’t just taking pictures of houses and stores. They were fitted with air pollutions sensors, built by environmental monitoring startup Aclima, and they were taking a reading of ambient air pollution every second.
The mobile sensors monitor a host of environmental pollutants: nitrogen dioxide, nitric oxide, ozone, carbon monoxide, carbon dioxide, methane, black carbon, particulate matter and volatile organic compounds. The goal is to track the density of these pollutants and how they change during the day, so that city residents have a sense of what they’re inhaling and can adapt their habits.
"We know that during peak times of traffic you might see one pattern, and you can see how that pollution flows over time depending on wind speed and weather," says Davida Herzl, Aclima's CEO. "It starts to be a little bit predictive, and you come up with the city’s own air DNA, its own fingerprint.”
The three cars in Denver gathered 150 million data points to create a spatial and temporal map of air pollution in the city.

The EPA, which partnered with Aclima and Google for the test, has air pollution sensors in specific locations across Denver and other cities. The sensors provide consistent data points over time, but, because they’re stationary, they can’t show how pollution moves through space and how it impacts places that aren’t within range.
“If you think of it like a photograph, we’re filling in a lot more pixels about how pollutants and climate change gases move through cities,” Herzl says. “The existing EPA ones provided really good temporal data at one place, but they didn’t have good spatial resolution. This is a total snapshot of pollution in a city.”
To get that spatial data, Aclima had to build sensors that could withstand weather and process data at high speeds. They send data back to a cloud, which Aclima built and monitors, and then sort and analyze that data to find patterns and trends. The Denver test was a dry run to make sure the sensors worked in the wild.
The sensors figured out which pollutants were present and then how the concentrations of those pollutants ebbed and flowed during the day, depending on traffic, weather, photochemistry and ozone density. For instance, in morning rush hour, there are lots of cars on the road and the ground temperature is cool. These conditions translate to high levels of nitric oxide and a low atmospheric boundary layer, so pollution will be high close to the ground.
“What’s so powerful about this data is that everything that goes into the atmosphere ends up in our bodies,” Herzl says. “Climate change feels far away, but what we’re putting in the atmosphere that’s changing the climate is also changing our bodies, and now we can see that. There’s been a lot of work on transparency about food and water quality. Now, we’re working on air.”
The Denver drives were a test to see if Aclima, could get a solid, scalable data set from drive-by sensing. The three cars drove a series of different laps through the city over a wide range of time and collected similar data points.
Eventually, Aclima wants their sensors to be on Street View cars in all major cities, and they’re working with policy makers and environmental groups to determine the best uses for the data. The data collected might inform changes to traffic patterns or decisions on where to build parks, bike lanes and green barriers around schools that are in high risk zones. In early August, Aclima started a second study in the Bay Area.
“What we’re doing in the Bay is exploring the big picture, actually mapping to find the patterns,” Herzl says. “It comes back to the old adage, ‘you cannot manage what you don’t measure.’”
/https://tf-cmsv2-smithsonianmag-media.s3.amazonaws.com/accounts/headshot/DSC_0196_2.JPG)