Largest 3-D Map of the Sky Released
Researchers have released the largest 3-D map of the sky with plans for further research into dark energy, quasars and the evolution of large galaxies
/https://tf-cmsv2-smithsonianmag-media.s3.amazonaws.com/accounts/headshot/Leah-Binkovitz-240.jpg)
How does one map the sky? It’s a daunting proposal to be sure and no Google cars or cameras are up to the task, but the team behind the Sloan Digital Sky Survey is making headway. The group, now in their third phase of research, recently released the largest ever 3-D map of the sky with some 540,000 galaxies.
Large though it is, the recent map covers a mere eight percent of the sky. By mid-2014, the team, led by Daniel Eisenstein at the Harvard-Smithsonian Center for Astrophysics, will have gathered enough additional information to complete a quarter of the sky.
Other than making a very cool animated video (above) about the project, in which viewers can seem to sail by almost 400,000 galaxies, the map will prove useful in a variety of research projects, from dark energy to quasars and the evolution of large galaxies, and the new information provides more accurate data than any other previous sky survey. Using a combination of imaging and spectroscopy, scientists are able to chart the distance of galaxies and other objects within 1.7 percent precision. In the past, the distances of bodies in space could only be measured by the far less precise Doppler shift observation of Hubble’s Law.
“That’s a very provocative value of precision because astronomers spent a lot of the last century arguing about whether the Hubble Constant was 50 or 100, which is basically arguing about a factor of two in distance. Now we’re using this method to get to precisions approaching a percent,” explains Eisenstein.
The mapping method relies on something called the baryon acoustic oscillation, which is “caused by sound waves that propagate in the first million years after the Big Bang,” Eisenstein explains. “These sound waves basically cause a tiny correlation between regions of space 500 million light years apart.” In the years after the Big Bang, as one galaxy formed and became too dense, it would emit a sound wave. “That sound wave travels out to a distance that corresponds today with 500 million light years and where it ends up produces (a region) slightly more enhanced than its galaxy population.” In other words, there is a slightly above average dispersion of galaxies 500 million light years apart than there are at 600 or 400 million light years.
“Because we know these sound waves pick out a distance of 500 million light years, now we can actually measure distance , so in the survey we’ve measured the distance to these galaxies.”
These more accurate measurements mean exciting news for the search for dark energy, the acceleration of the expansion of the universe. “The way we measure dark energy is by measuring distances to certain objects with very high precision,” says Eisenstein.
The method for taking these measurements is surprisingly physical in nature. Initial imaging allows the scientists to get a basic map of what objects are where in a certain region of the sky: quasars, galaxies, stars and other items. They then select which objects would be useful for further study. Since so many teams, including the Lawrence Berkeley National Laboratory and the University of Cambridge, are involved, different groups pick different objects depending on their area of research.
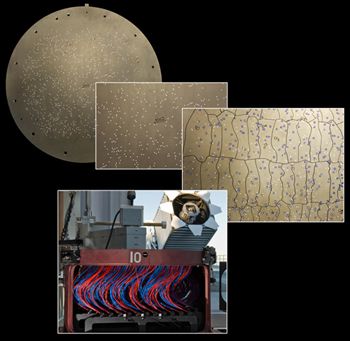
Moving onto spectroscopy, the researchers can measure 1,000 objects at a time. On a large aluminum disk, they drill holes to correspond to each objects’ position. “On a given plate there might be 700 galaxies and 200 quasar candidates and 100 stars,” Eisenstein explains. Then the team will hand-place fiber optic cables into each hole. Light from each object hits the cables and is taken to the instrument. The disk sits for an hour to absorb the light and then it’s on to the next portion of the sky. Some nights the team will fill up to nine disks, but that’s rare.
Visitors can view some of the materials used by the sky survey team at the Air and Space Museum, including a charge couple device that converts light into electrical signals that can be read digitally to create a functional map.
When the project is completed, they will have 2,200 plates and a map of some two million objects. And you’ll have the night sky at your fingertips. Google that!
/https://tf-cmsv2-smithsonianmag-media.s3.amazonaws.com/accounts/headshot/Leah-Binkovitz-240.jpg)