Here’s How the Enhanced Fujita Scale Works, and This Is What It Looks Like
The Moore, Oklahoma tornado was upgraded to an EF-5 storm
/https://tf-cmsv2-smithsonianmag-media.s3.amazonaws.com/accounts/headshot/smartnews-colin-schultz-240.jpg)
/https://tf-cmsv2-smithsonianmag-media.s3.amazonaws.com/filer/2013052311203405_23_2013_moore-damage-scale.jpg)
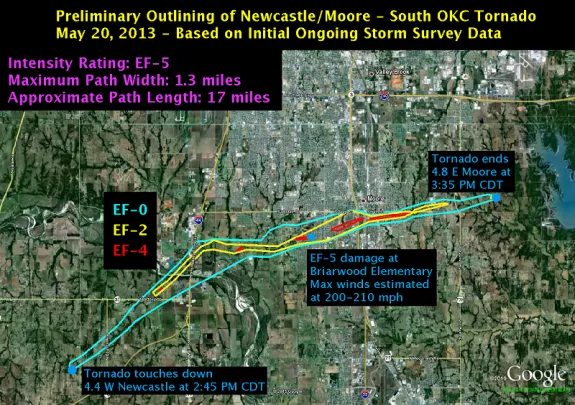
On Monday, we tried to put the tornado that ripped through central Oklahoma, killing 24 people, in historical context. The tornado stayed on the ground for 40 minutes, and the path of destruction was estimated to be 1.3 miles across at its widest. Winds blew at more than 200 miles per hour. We wrote how this monster storm fit in with what we know about tornadoes:
There are a lot of parameters by which a tornado can be deemed the worst, and by pretty much all counts today’s Moore tornado is up there. The National Oceanographic and Atmospheric Administration keeps a list of historical tornadoes—devastating twisters known for their size, their duration and their destruction. Though the Moore tornado doesn’t trump any of them, its combination of size, strength and duration made it an incredibly dangerous storm.
The aftermath of the storm has seen the clean-up and damage assessment begin. So far, the damage caused by the storm is estimated to have been in the range of $2 billion, a sum that would make this the 3rd most expensive U.S. tornado of all time.
At first, the storm was rated an EF-4 on the Enhanced Fujita scale. Since then, it has been upgraded to an EF-5, the highest ranking on the scale. The is the the 59th level 5 storm in the past 63 years. Though many people think of the Enhanced Fujita scale as a scale of wind speed, it is actually a scale for damage. By looking at the amount of damage caused to different types of structures, scientists assign the storm an Enhanced Fujita scale classification. From the amount of damage they see, they then try to reverse engineer the storm’s wind speeds.
As it tracks along the ground, a tornado’s power can change. By looking at the damage, you can see how the storm evolved. The National Weather Service put out this map showing how the Moore tornado grew from an EF-0 when it first touched down to an EF-4 in the heart of the city. It also briefly spiked up to EF-5 based on the damage seen at the Briarwood Elementary school.
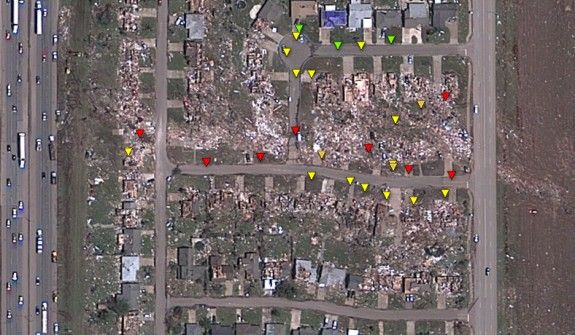
On Google’s Crisis Map, you can see the scar cut into the city by the tornado. Dotting the map are little triangles, each color-coded by the EF scale rating, with light blue being EF-0 and purple EF-5. Clicking on each of these triangles shows a description of the damage at the site and in many cases a photograph, a clear, if depressing, visualization of the Enhanced Fujita scale.
More from Smithsonian.com:
How to Understand the Scale of the Oklahoma Tornado
/https://tf-cmsv2-smithsonianmag-media.s3.amazonaws.com/accounts/headshot/smartnews-colin-schultz-240.jpg)