Explore Every Tornado Across the United States Since 1980 Through This Interactive Map
See why they call it Tornado Alley, but don’t be fooled into thinking a tornado can’t happen in your own backyard
Across the United States, signs of spring are emerging, even as cold weather and a snowstorm threatens the Northeast. In most places, spring brings flower buds, balmy temperatures and a renewed green landscape, but in the central and southern United States, it also brings a force of destruction: tornado season.
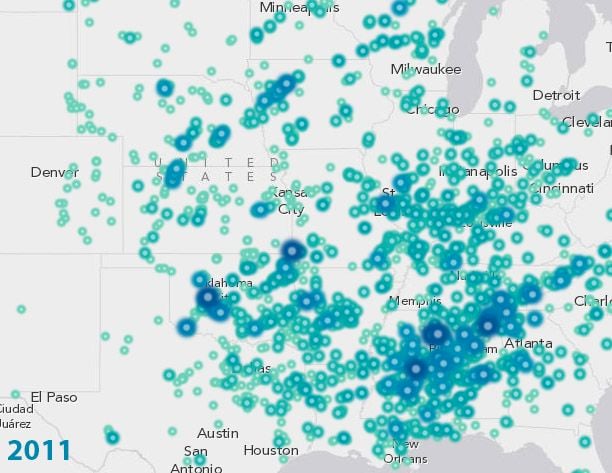
Generally, these dangerous storms run from late winter to mid summer, but the season tends to vary slightly from region to region. A new interactive map from ESRI allows you to explore the history of tornadoes in your own state, region, or even backyard. The map shows every tornado to touch down in the U. S. from 1980 to 2012, and includes details on casualties and where each ranks on the Enhanced Fujita scale – a system scientists have used to rate tornadoes since 1971 (and was updated in 2007). The scale is calculated from the damage that the tornado inflicted and the wind speeds that would have been required to inflict such devastation.
So, why is spring the season of tornadoes? Here’s the highly simplified explanation behind why tornados form: warm, wet air in the lower atmosphere blows under cold, dry air in the upper atmosphere. During the spring, warm air in the jet stream coming off the Gulf of Mexico blows north and hits cold air coming out of the Arctic and off the Rocky Mountains. That year's tornado season varies based on local weather patterns and fluctuations in ocean surface temperatures. For example, warmer Pacific Ocean temperatures in 2013 shifted jet stream winds east toward Missouri and Tennessee, and away from the hotspot of Tornado Alley – from northern Texas to the lower edge of South Dakota.
The United States has seen 21 category five (EF-5) tornadoes, the highest ranking on the Enhanced Fujita scale, since 1980, and eight of those hit the traditional Tornado Alley. But, the high-frequency tornado risk area extends beyond the Great Plains, east to Tennessee and south to Alabama. In terms of the most damaging tornadoes since 1980, an April 27, 2011, EF-4 twister left 1500 injured in central Alabama,and was part of a devastating tornado outbreak in the region over several days. That same year, a tornado ripped through Joplin, Missouri, killing 158 people, injuring 1150, and left $2.8 billion in property damage in its wake. The Joplin twister, an EF-5, was the deadliest tornado since 1950, and the 7th deadliest in U.S. history.
Like the Joplin event, most tornadoes form in extreme thunderstorms called supercells, but ESRI’s map echoes the mantra of meteorologists and wind engineers: tornadoes can form at any time and in any place. By geographical happenstance, the central United States is home to tornado-producing weather patterns, but tornadoes touch down outside the continental U. S., as well. Hawaii saw 39 tornadoes from 1950 to 2010, and some of these are waterspouts, funnels that either form on land and move to water or form over water and move to land. Even Alaska experiences a rare tornado, if the conditions are right.
For more on tornado science, see NOAA’s Tornado Q&A site compiled by Roger Edwards of the Storm Prediction Center, and for more on tornado preparedness, visit FEMA’s tornado site.
/https://tf-cmsv2-smithsonianmag-media.s3.amazonaws.com/accounts/headshot/Screen_Shot_2014-01-27_at_12.05.16_PM.png)