What’s the Environmental Footprint of a T-Shirt?
In-depth life cycle analyses are teaching us more about the environmental costs of the things we wear
/https://tf-cmsv2-smithsonianmag-media.s3.amazonaws.com/filer/9c/e4/9ce42b17-c80d-41f1-b2c5-7ff6ab18c37e/t-shirts.jpg)
That T-shirt you’re wearing—do you know how much water was used to make it? How much fuel expended to ship it? How many ounces of scraps were cast aside from the trimmings? Sandra Roos does. A PhD student at Chalmers Institute of Technology in Sweden, Roos performed one of the most comprehensive life cycle analyses ever completed, in the process learning more about the resources and tradeoffs that go into fashion than just about anyone, ever.
With her analysis, Roos, who is studying environmental systems analysis, incorporated several aspects of the life cycle that haven’t been put together, at least not for fashion. The report, published by cross-disciplinary research program Mistra Future Fashion, included the costs of daily use, discard or recycling a garment, and even the fuel to get to the store to buy the thing (an important factor, it turns out). She evaluated different items—five of them, including a T-shirt, a pair of jeans, a dress, a jacket and a hospital uniform—and compared them against each other. Some of what she found was surprising; some not so much. But each bit of information tells us a little more about an industry that can affect our world in ways we don’t comprehend.
Environmental footprint is something we understand fairly well in food, Roos analogizes. “We all know that carrots and beef are very different, and organic bananas and conventional bananas are different, but when it comes to textiles, we cannot really comprehend this difference,” she says. “You can have very environmentally friendly textiles that are organic carrots, and you can have very climate intensive garments that are more like meat.”
A basic life cycle analysis typically follows a product from creation, including obtaining or making the raw materials, through disposal, whether that’s discarding, recycling, or otherwise getting rid of it. The more elements of the cycle that are incorporated, the more accurate the picture that starts to form.
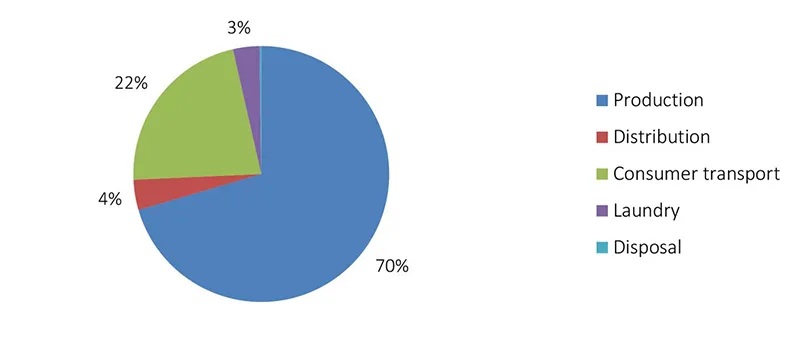
Roos divided the life cycle of the garments into four stages: the production of the garment, the distribution and sale, the use, and the disposal, which she called “end of life.” Within each of these, she added up the effects of a number of environmental indicators, including water use, non-renewable energy use, agricultural land occupation, carbon footprint, freshwater toxicity and eutrophication, toxicity in humans (carcinogen and otherwise), air pollution, acidification, and more.
But to do this for different types of garments basically requires repeating it for each one, substituting materials, measuring amount of each material, estimating workers’ hours, and even evaluating style and duration of wear. T-shirts are washed more often than jackets, for example. Roos chose the garments she did because they give a cross section of a typical wardrobe.
She looked at the thickness of the fibers in each garment, whether they are knitted or woven, even techniques you didn’t realize were part of the process, like confectioning—it means cutting, and the waste created there, plus printing, ironing, packaging, and even the air conditioning for the personnel working on this stage.
For example: “The weight of the dress was 478 g. It consisted of a woven and printed exterior of 241 g PES [polyester], measured as 119 dtex (warp) and 114 dtex (weft) [measurements of the thickness of the fiber in the different directions of the weave] and a knitted black PES lining of 231 g, measured as 114 dtex. There was also a small amount of back elastic. The sewing of the dress was assumed to take 20 minutes.”
The accumulated effects don’t come down to one number. You can’t say jeans score a 5, and T-shirts an 8, but each footprint shows a series of numbers. Jeans, for example, require almost 70 liters of freshwater per wear. Dyeing them adds around 0.004 kilograms of carbon dioxide to the atmosphere per wear. A T-shirt can use up to 120 liters of water per wear, and contributes 0.01 kilogram of carbon dioxide per wear, just from dyeing alone. (Most of that is a division of the water and carbon used in making the jeans, so extending the life of the garment diminishes the impact.) Each of these numbers varies greatly, and gives just a small picture of the overall impact. Viewed together, they can show the differences between materials and garments.
Roos then scaled up the estimate to see what the impact would be for a whole country—Sweden, where she lives. The average Swede buys nine T-shirts per year, and wears a T-shirt 200 times per year, according to Statistics Sweden, a national administrative agency. That gives an average of 22 wears per shirt, per year, and they wash them, on average, once every two wears. Because people buy many more shirts than jackets, the scaled-up impacts look very different.
So what good does this information do us? A life cycle analysis is not easily distilled into consumable nuggets, but for concerned shoppers, there are some basic takeaways.
“Everyone is talking about [how] you should wash [at] a low temperature,” says Roos. “When we calculate how much the washing temperature actually did influence the climate, we saw that … it has less than 1 percent of the climate impact. But 22 percent came from the transport, to and from the store.”
Washing in hot water, she adds, has negligible effect, and might even help, if it means the clothes are cleaner and must be washed less often. But most important, by far, is the number of times consumers wear a garment before throwing it out.
Roos and collaborators at Mistra Future Fashion, which partnered with Chalmers, are setting up a tool that will allow companies to evaluate their product pipelines. The project is in early stages and Roos is still determining what form it will take.
Some big takeaways are already clear, like how greatly spin dyeing can reduce water use compared to wet dyeing, or how much smaller the carbon footprint of fabric made from dissolved wood cellulose is, compared to cotton. But while life cycle analyses give a broad understanding of the impacts in a product’s life, the incredible level of detail means that it can’t be performed for every product, and that its relevance to any other product than the subject is limited, says Jason Kibbey, CEO of the Sustainable Apparel Coalition. He doesn’t mean Roos’ work, so much as the challenges of translating any life cycle analysis to practical use.
“In general, the issue is, what can you get to scale? There’s a massive plethora of tools out there that have assessed various elements of the supply chain, and there’s a lot to learn from some of that underlying research, and often from those tools themselves,” Kibbey says. “The vast majority of them barely have any users.”
The Sustainable Apparel Coalition offers a tool called the Higg Index, with a standardized point system, to help its partner companies understand and improve their product footprints and compare their products to the rest of the industry.
“The big, long challenge that everyone has is, how do you communicate all this information to consumers, and to all of the stakeholders and decision makers in a way that they understand the impacts of good decision making?” Kibbey says.