What Can Bees Teach Us About Gang Warfare?
In Los Angeles, an anthropologist is using equations to teach police about how street gangs operate
/https://tf-cmsv2-smithsonianmag-media.s3.amazonaws.com/accounts/headshot/joseph-stromberg-240.jpg)
/https://tf-cmsv2-smithsonianmag-media.s3.amazonaws.com/filer/Mapping-Turf-Wars-631.jpg)
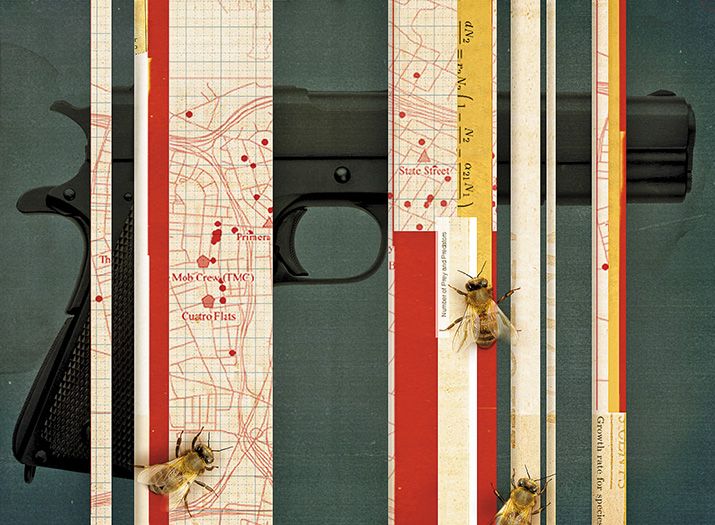
In the 1920s, Alfred Lotka, an American statistician, and Vito Volterra, an Italian mathematician, observed that similarly sized rival groups of a species—from honeybees to hyenas—claim territories whose boundaries form a perpendicular line halfway between each group’s home base (a hive or den). The Lotka-Volterra equations, as the findings are known, became a staple of ecological theory.
P. Jeffrey Brantingham, an anthropologist at UCLA who uses statistics to study crime, has applied the equations to a decidedly different population. He and his colleagues identified 13 criminal gangs of roughly equal size in the Boyle Heights neighborhood of Los Angeles’ East Side. For each one, they drew upon police research to pick out an anchor point—a house or street corner—that func-tioned as the gang’s home base. Then, using Lotka-Volterra-based equations, they drew theoretical borders between the gangs’ turf.
“The model says that if you have two gangs that are equal in their competitive abilities, the boundary between them will be equidistant and perpendicular between their anchor points,” Brantingham says. “It’s a nice, simple, geometric organization.”
Viewing the rivalries in that light enabled the researchers to predict where violence between gangs was most likely to take place: 58.8 percent would occur less than a fifth of a mile from the borders, 87.5 percent within two-fifths of a mile and 99.8 percent within a full mile. Mapping the actual 563 gang-related shootings in the area from 1999 to 2002, the researchers found that their predictions were almost dead on: The distribution of real-life shootings was 58.2 percent, 83.1 percent and 97.7 percent, respectively.
Although police officials also draw maps of gang territories, the researchers say their map better reflects criminal activity because it doesn’t let geographic conventions dictate the borders. “It’s easier to draw a boundary along a main road than it is through somebody’s backyard,” Brantingham says.
Lt. Chris Marks, a gang specialist with the Los Angeles County Sherriff’s Department (which was not involved with the study), agrees that most criminal activity occurs along the borders between gang territories, but cautions that these boundaries can change rapidly.
The UCLA team plans to continue testing their territory maps. They envision that their model could provide a valuable tool for police departments nationwide as they attempt to predict the location of gang violence. “Let’s imagine two gangs just appear in an environment for the first time,” Brantingham says. “Where should you put your police resources? This model does a relatively good job of figuring that out before any violence even happens.”
There’s no reason to believe that some of the tenets of wildlife biology wouldn’t apply to this ecosystem, too. “It’s surprising for many people, because we have an overinflated sense of uniqueness as a species,” Brantingham says, “but millions of years of evolution have created similar solutions to common problems, regardless of what species you’re talking about.”
/https://tf-cmsv2-smithsonianmag-media.s3.amazonaws.com/accounts/headshot/joseph-stromberg-240.jpg)