This New Mapping Tool Shows City Planners Where to Plant Trees
Researchers at Portland State University have created an app that looks at tree density in respect to neighborhood, population and pollution
/https://tf-cmsv2-smithsonianmag-media.s3.amazonaws.com/accounts/headshot/DSC_0196_2.JPG)
/https://tf-cmsv2-smithsonianmag-media.s3.amazonaws.com/filer/5c/62/5c62169c-8ad2-4b04-8603-c463ce4c35e6/metro.jpg)
How green is your neighborhood? It might be worth noticing. In cities, tree cover is one of the most visible indicators of neighborhood income, and vegetation density is directly tied to health outcomes, especially for vulnerable group, such as kids, the elderly and people living below the poverty line. The U.S. Forest Service estimates that trees save 850 lives and deflect 670,000 incidences of acute respiratory symptoms each year.
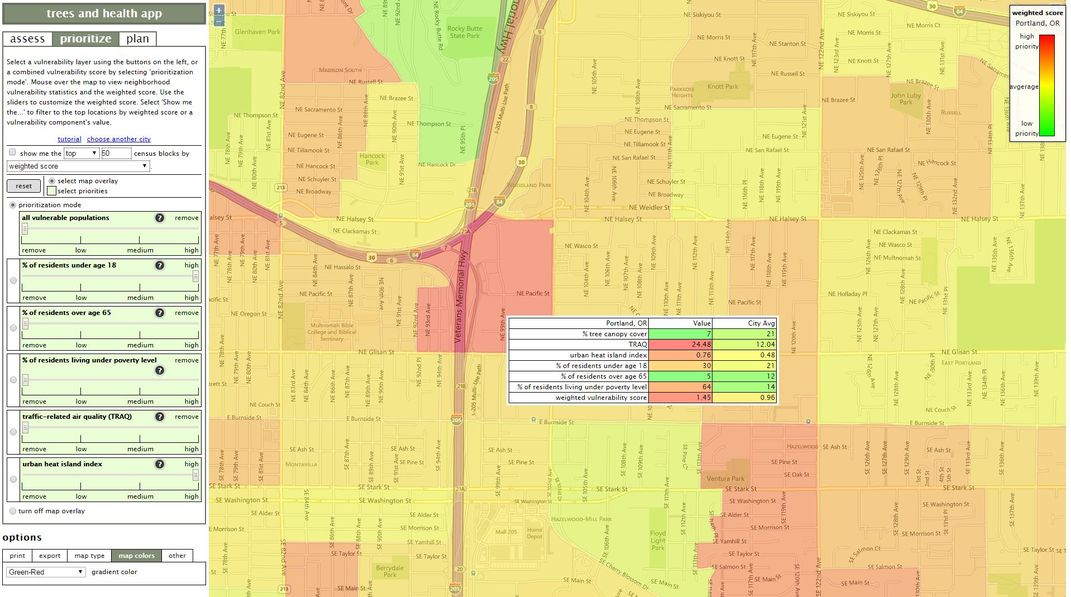
To give communities a way to change their tree cover, a research team at Portland State University has built a mapping tool, called the Trees and Health App, that overlays tree density with vulnerability. Users can see where poverty intersects with lack of vegetation. The tool also lets urban planners, neighborhood groups, and local government find the most polluted neighborhoods in their city and then figure out how many trees they would have to plant, and where to put them, to improve air quality.
“We’ve spent the last five years trying to assess how trees are improving neighborhood-scale air quality,” says Vivek Shandas, a professor of urban studies and planning who led the project, funded by the U.S. Forest Service. “We want to make the science and policy more resolved in how we manage highly local exposure.”
Most air quality mapping is done at the state or airshed level. Airsheds, or air supplies of particular geographic regions, can cover hundreds of miles of land. But Shandas and his colleagues have found that trees have an impact on a neighborhood level. If there’s a park 80 miles from you, it doesn’t really make a difference in the pollution levels in your immediate area.
To build the mapping tool, the team first established a baseline for how much of a difference trees make. They started in Portland, where they placed 144 pollution sensors across the city to monitor air quality. Then, using Forest Service and U.S. Geological Survey maps, they looked at tree cover and, more specifically, what types of trees grew where.
“We found that upward of 14 percent of the pollutants are improved by local neighborhood trees and that the kind of trees does matter," says Shandas. "Portland is highly coniferous and those [trees] almost act like scrubbers in the summer, but deciduous trees are becoming more dominant in urban landscapes.”
The researchers then overlayed a series of pollution sources, including factories, trains and busy highways, and sinks, such as parks that soak up ambient pollutants, with readily available census data about income and age.
“We chose three social factors known to be important for impacting public health: older adults, children under 18 and people below the poverty line,” Shandas says. “Those three factors commensurate with places that are hot and dirty. We know that trees can help to mitigate air pollutants, and we’ve also seen thermal regulation through tree planting.”
The team created the tool for Portland and then received a National Science Foundation grant to expand it to 13 other cities, inluding Sacramento, Phoenix and Pittsburgh. The researchers picked urban areas with populations between 400,000 and 700,000 people, because these cities are big enough to have a voter base to push for more trees, but small enough that planting efforts would make a difference.
“The pattern of vegetation in cities isn’t random,” Shandas says. “It’s chicken and egg. We didn’t know if wealth followed trees or trees followed wealth, but we do know that where the hottest, dirtiest, most vulnerable populations are in these cities is where we want to focus theses efforts.”

The tool lets users "assess," "prioritize" and "plan." The "assess" function points out the vulnerable areas in a city, based on age and poverty level, and indicates how much they overlap with tree-filled areas. "Prioritize" drills down to specific at-risk groups. With the "plan" feature, the most innovative part of the tool, users can set pollution level goals for their neighborhood and then adjust to see maps of the planting projects they’d need to do to achieve them. In Albuquerque, for instance, city officials have noticed the disparity between neighborhoods like the so-called "war zone," where there is 3 percent tree cover and 33 percent of the population lives below the poverty level, and ritzier Nob Hill, which has 12 percent tree cover and only 12 percent of the population living in poverty.
The Trees and Health App is being put to use in Portland, where the city and Multnomah County just passed a climate action plan informed, in part, by Portland State University's work on heat islands and tree cover. Neighborhood groups are using the tool to set agendas. The Johnson Creek Watershed Council, for instance, is working on a tree planting project in the diverse Powellhurst-Gilbert neighborhood in southeast Portland.
Later this summer, the PSU group is building out a more detailed tool that’s specific to Portland. It will include social variables, such as linguistically-isolated populations and data on homes and buildings with and without air conditioning. Shandas says that the most interesting part has been how the work is pulling in people from a lot of different fields.
"It’s co-production of knowledge,” he says, “which is a $10 way to say that multiple sectors are coming together to produce a set of knowledge that can be agreed and acted upon. There’s so much information and data that’s residing in various people’s desktops.”
/https://tf-cmsv2-smithsonianmag-media.s3.amazonaws.com/accounts/headshot/DSC_0196_2.JPG)