Life in the City Is Essentially One Giant Math Problem
Experts in the emerging field of quantitative urbanism believe that many aspects of modern cities can be reduced to mathematical formulas
/https://tf-cmsv2-smithsonianmag-media.s3.amazonaws.com/filer/X-and-the-City-math-graphic-631.jpg)
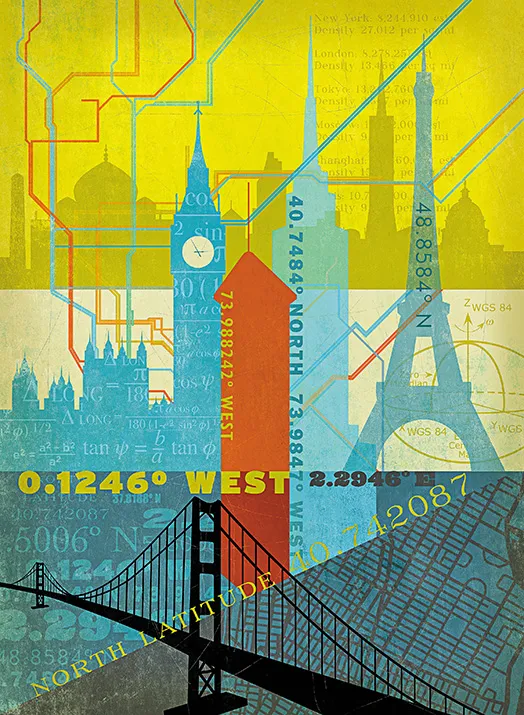
Glen Whitney stands at a point on the surface of the Earth, north latitude 40.742087, west longitude 73.988242, which is near the center of Madison Square Park, in New York City. Behind him is the city’s newest museum, the Museum of Mathematics, which Whitney, a former Wall Street trader, founded and now runs as executive director. He is facing one of New York’s landmarks, the Flatiron Building, which got its name because its wedge- like shape reminded people of a clothes iron. Whitney observes that from this perspective you can’t tell that the building, following the shape of its block, is actually a right triangle—a shape that would be useless for pressing clothes—although the models sold in souvenir shops represent it in idealized form as an isosceles, with equal angles at the base. People want to see things as symmetrical, he muses. He points to the building’s narrow prow, whose outline corresponds to the acute angle at which Broadway crosses Fifth Avenue.
“The cross street here is 23rd Street,” Whitney says, “and if you measure the angle at the building’s point, it is close to 23 degrees, which also happens to be approximately the angle of inclination of the Earth’s axis of rotation.”
“That’s remarkable,” he is told.
“Not really. It’s coincidence.” He adds that, twice each year, a few weeks on either side of the summer solstice, the setting sun shines directly down the rows of Manhattan’s numbered streets, a phenomenon sometimes called “Manhattanhenge.” Those particular dates don’t have any special significance, either, except as one more example of how the very bricks and stones of the city illustrate the principles of the highest product of the human intellect, which is math.
Cities are particular: You would never mistake a favela in Rio de Janeiro for downtown Los Angeles. They are shaped by their histories and accidents of geography and climate. Thus the “east-west” streets of Midtown Manhattan actually run northwest-southeast, to meet the Hudson and East rivers at roughly 90 degrees, whereas in Chicago the street grid aligns closely with true north, while medieval cities such as London don’t have right-angled grids. But cities are also, at a deep level, universal: the products of social, economic and physical principles that transcend space and time. A new science—so new it doesn’t have its own journal, or even an agreed-upon name—is exploring these laws. We will call it “quantitative urbanism.” It’s an effort to reduce to mathematical formulas the chaotic, exuberant, extravagant nature of one of humanity’s oldest and most important inventions, the city.
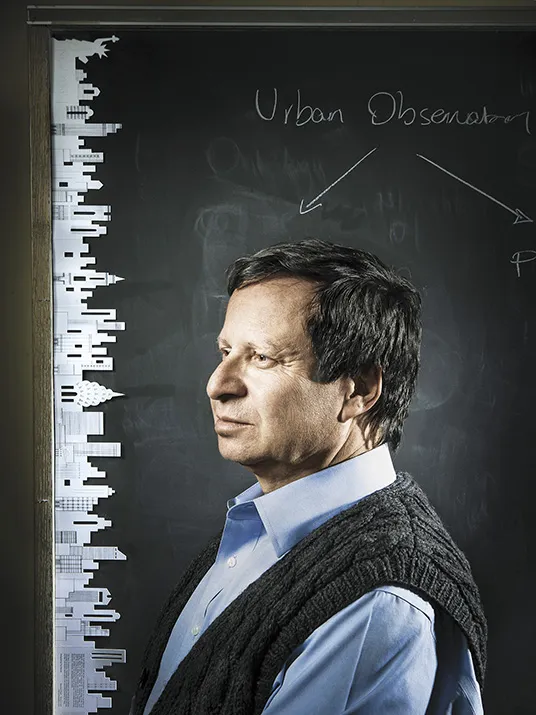
The systematic study of cities dates back at least to the Greek historian Herodotus. In the early 20th century, scientific disciplines emerged around specific aspects of urban development: zoning theory, public health and sanitation, transit and traffic engineering. By the 1960s, the urban-planning writers Jane Jacobs and William H. Whyte used New York as their laboratory to study the street life of neighborhoods, the walking patterns of Midtown pedestrians, the way people gathered and sat in open spaces. But their judgments were generally aesthetic and intuitive (although Whyte, photographing the plaza of the Seagram Building, derived the seat-of-the-pants formula for bench space in public spaces: one linear foot per 30 square feet of open area). “They had fascinating ideas,” says Luís Bettencourt, a researcher at the Santa Fe Institute, a think tank better known for its contributions to theoretical physics, “but where is the science? What is the empirical basis for deciding what kind of cities we want?” Bettencourt, a physicist, practices a discipline that shares a deep affinity with quantitative urbanism. Both require understanding complex interactions among large numbers of entities: the 20 million people in the New York metropolitan area, or the countless subatomic particles in a nuclear reaction.
The birth of this new field can be dated to 2003, when researchers at SFI convened a workshop on ways to “model”—in the scientific sense of reducing to equations—aspects of human society. One of the leaders was Geoffrey West, who sports a neatly trimmed gray beard and retains a trace of the accent of his native Somerset. He was also a theoretical physicist, but had strayed into biology, exploring how the properties of organisms relate to their mass. An elephant is not just a bigger version of a mouse, but many of its measurable characteristics, such as metabolism and life span, are governed by mathematical laws that apply all up and down the scale of sizes. The bigger the animal, the longer but the slower it lives: A mouse heart rate is around 500 beats per minute; an elephant’s pulse is 28. If you plotted those points on a logarithmic graph, comparing size with pulse, every mammal would fall on or near the same line. West suggested that the same principles might be at work in human institutions. From the back of the room, Bettencourt (then at Los Alamos National Laboratory) and José Lobo, an economist at Arizona State University (who majored in physics as an undergraduate), chimed in with the motto of physicists since Galileo: “Why don’t we get the data to test it?”
Out of that meeting emerged a collaboration that produced the seminal paper in the field: “Growth, Innovation, Scaling, and the Pace of Life in Cities.” In six pages dense with equations and graphs, West, Lobo and Bettencourt, along with two researchers from the Dresden University of Technology, laid out a theory about how cities vary according to size. “What people do in cities—create wealth, or murder each other—shows a relationship to the size of the city, one that isn’t tied just to one era or nation,” says Lobo. The relationship is captured by an equation in which a given parameter—employment, say—varies exponentially with population. In some cases, the exponent is 1, meaning whatever is being measured increases linearly, at the same rate as population. Household water or electrical use, for example, shows this pattern; as a city grows bigger its residents don’t use their appliances more. Some exponents are greater than 1, a relationship described as “superlinear scaling.” Most measures of economic activity fall into this category; among the highest exponents the scholars found were for “private [research and development] employment,” 1.34; “new patents,” 1.27; and gross domestic product, in a range of 1.13 to 1.26. If the population of a city doubles over time, or comparing one big city with two cities each half the size, gross domestic product more than doubles. Each individual becomes, on average, 15 percent more productive. Bettencourt describes the effect as “slightly magical,” although he and his colleagues are beginning to understand the synergies that make it possible. Physical proximity promotes collaboration and innovation, which is one reason the new CEO of Yahoo recently reversed the company’s policy of letting almost anyone work from home. The Wright brothers could build their first flying machines by themselves in a garage, but you can’t design a jet airliner that way.
Unfortunately, new AIDS cases also scale superlinearly, at 1.23, as does serious crime, 1.16. Lastly, some measures show an exponent of less than 1, meaning they increase more slowly than population. These are typically measures of infrastructure, characterized by economies of scale that result from increasing size and density. New York doesn’t need four times as many gas stations as Houston, for instance; gas stations scale at 0.77; total surface area of roads, 0.83; and total length of wiring in the electrical grid, 0.87.
Remarkably, this phenomenon applies to cities all over the world, of different sizes, regardless of their particular history, culture or geography. Mumbai is different from Shanghai is different from Houston, obviously, but in relation to their own pasts, and to other cities in India, China or the U.S., they follow these laws. “Give me the size of a city in the United States and I can tell you how many police it has, how many patents, how many AIDS cases,” says West, “just as you can calculate the life span of a mammal from its body mass.”
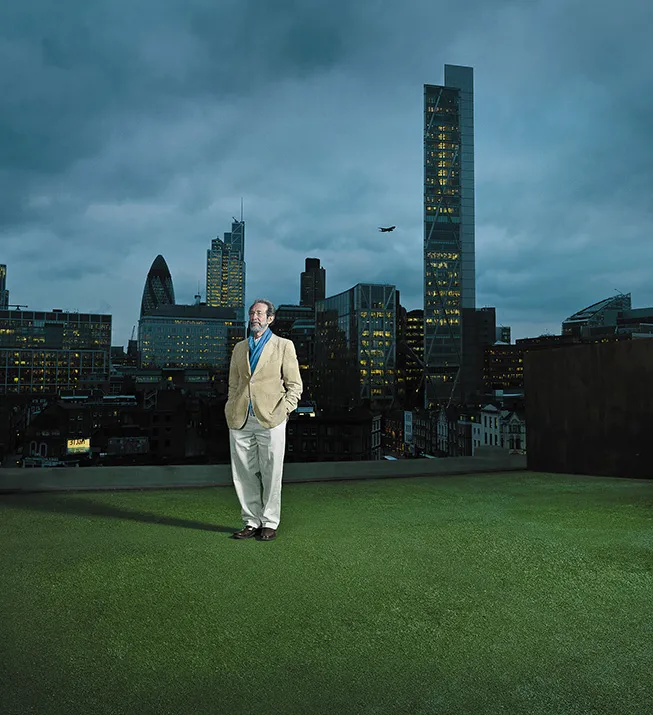
One implication is that, like the elephant and the mouse, “big cities are not just bigger small cities,” says Michael Batty, who runs the Centre for Advanced Spatial Analysis at University College London. “If you think of cities in terms of potential interactions [among individuals], as they get bigger you get more opportunities for that, which amounts to a qualitative change.” Consider the New York Stock Exchange as a microcosm of a metropolis. In its early years, investors were few and trades sporadic, Whitney says. Hence “specialists” were needed, intermediaries who kept an inventory of stock in certain companies, and would “make a market” in the shares, pocketing the margin between their selling and buying price. But over time, as more participants joined the market, buyers and sellers could find one another more easily, and the need for specialists—and their profits, which amounted to a small tax on everyone else—diminished. There is a point, Whitney says, at which a system—a market, or a city—undergoes a phase shift and reorganizes itself in a more efficient and productive way.
Whitney, who has a slight build and a meticulous manner, walks swiftly through Madison Square Park to the Shake Shack, a hamburger stand famous for its food and its lines. He points out the two service windows, one for customers who can be served quickly, the other for more complicated orders. This distinction is supported by a branch of mathematics called queuing theory, whose fundamental principle can be stated as “the shortest aggregate waiting time for all customers is achieved when the person with the shortest expected wait time is served first, provided the guy who wants four hamburgers with different toppings doesn’t go berserk when he keeps getting sent to the back of the line.” (This assumes that the line closes at a certain time so everyone gets served eventually. The equations can’t handle the concept of an infinite wait.) That idea “seems intuitive,” says Whitney, “but it had to be proved.” In the real world, queuing theory is used for designing communications networks, in deciding which packet of data gets sent first.
At the Times Square subway station, Whitney buys a fare card, in an amount he has calculated to take advantage of the bonus for paying in advance and come out with an even number of rides, with no money left unspent. On the platform, as passengers rush back and forth between trains, he talks about the mathematics of running a transit system. You might think, he says, that an express should always leave as soon as it’s ready, but there are times when it makes sense to hold it in the station—to make a connection with an incoming local. The calculation, simplified, is this: Multiply the number of people on the express train by the number of seconds they will be kept waiting while it idles in the station. Now estimate how many people on the arriving local will transfer, and multiply that by the average time they will save by taking the express to their destination rather than the local. (You’ll have to model how far passengers who bother to switch are going.) This can lead to the potential savings, in person-seconds, for comparison. The principle is the same at any scale, but it is only above a certain size of population that the investment in dual-track subway lines or two-window hamburger stands makes sense. Whitney boards the local, heading downtown toward the museum.
***
It also can be readily seen that the more data you have on transit usage (or hamburger orders), the more detailed and accurate you can make these calculations. If Bettencourt and West are building a theoretical science of urbanism, then Steven Koonin, the first director of New York University’s newly created Center for Urban Science and Progress, intends to be in the forefront of applying it to real-world problems. Koonin, as it happens, is also a physicist, a former Cal Tech professor and assistant secretary of the Department of Energy. He describes his ideal student, when CUSP begins its first academic year this fall, as “someone who helped find the Higgs boson and now wants to do something with her life that will make society better.” Koonin is a believer in what is sometimes called Big Data, the bigger the better. Only in the past decade has the ability to collect and analyze information about the movement of people begun to catch up to the size and complexity of the modern metropolis itself. Around the time he took the job at CUSP, Koonin read a paper about the ebb and flow of population in Manhattan’s business district, based on an exhaustive analysis of published data on employment, transit and traffic patterns. It was a great piece of research, Koonin says, but in the future, that’s not how it will be done. “People carry tracking devices in their pockets all day long,” he says. “They’re called cellphones. You don’t need to wait for some agency to publish statistics from two years ago. You can get this data almost in real time, block by block, hour by hour.
“We have acquired the technology to know virtually anything that goes on in an urban society,” he adds, “so the question is, how can we leverage that to do good? Make the city run better, enhance security and safety and promote the private sector?” Here’s a simple example of what Koonin envisions, in the near future. If you are, say, deciding whether to drive or take the subway from Brooklyn to Yankee Stadium, you can consult a website for real-time transit data, and another for traffic. Then you can make a choice based on intuition, and your personal feelings about the trade-offs among speed, economy and convenience. This by itself would have seemed miraculous even a few years ago. Now imagine a single app that would have access to that data (plus GPS locations of taxis and buses along the route, cameras surveying the stadium’s parking lots and Twitter feeds from people stuck on FDR Drive), factor in your preferences and tell you instantly: Stay home and watch the game on TV.
Or some slightly less simple examples of how Big Data can be used. At a lecture last year Koonin presented an image of a large swath of Lower Manhattan, showing the windows of some 50,000 offices and apartments. It was taken with an infrared camera, and so could be used for environmental surveillance, identifying buildings, or even individual units, that were leaking heat and wasting energy. Another example: As you move around the city, your cellphone tracks your location and that of everyone you come into contact with. Koonin asks: How would you like to get a text message telling you that yesterday you were in a room with someone who just checked into the emergency room with the flu?
***
Inside the Museum of Mathematics, kids and the occasional adult manipulate various solids on a series of screens, rotating them, extending or compressing or twisting them into fantastical shapes, then extruding them in plastic on a 3-D printer. They sit inside a tall cylinder whose base is a rotating platform and whose sides are defined by vertical strings; as they twist the platform, the cylinder deforms into a hyperboloid, a curved surface that somehow is created out of straight lines. Or they demonstrate how it is possible to have a smooth ride on a square-wheeled tricycle, if you contour the track beneath it to keep the axle level. Geometry, unlike formal logic, which was Whitney’s field before he went to Wall Street, lends itself particularly well to hands-on experiment and demonstration—although there are also exhibits touching on fields he identifies as “calculus, calculus of variations, differential equations, combinatorics, graph theory, mathematical optics, symmetry and group theory, statistics and probability, algebra, matrix analysis—and arithmetic.” It troubled Whitney that in a world with museums devoted to ramen noodles, ventriloquism, lawn mowers and pencils, “most of the world has never seen the raw beauty and adventure that is the world of mathematics.” That’s what he set out to remedy.
As Whitney points out on the popular math tours he runs, the city has a distinctive geometry, which can be described as occupying two-and-a-half dimensions. Two of these are those you see on the map. He describes the half-dimension as the network of elevated and underground walkways, roads and tunnels that can only be accessed at specific points, like the High Line, an abandoned railroad trestle that has been turned into an elevated linear park. This space is analogous to an electronic printed-circuit board, in which, as mathematicians have shown, certain configurations cannot be achieved in a single plane. The proof is in the famous “three-utilities puzzle,” a demonstration of the impossibility of routing gas, water and electric service to three houses without any of the lines crossing. (You can see this for yourself by drawing three boxes and three circles, and trying to connect each circle to each box with nine lines that do not intersect.) In a circuit board, for conductors to cross without touching, one of them sometimes must leave the plane. Just so, in the city, sometimes you have to climb up or down to get to where you are going.
Whitney heads uptown, to Central Park, where he walks on a path that for the most part skirts the hills and declivities created by the most recent glaciation and improved by Olmsted and Vaux. On a certain class of continuous surfaces—of which parkland is one—you can always find a path that stays on one level. From various points in Midtown, the Empire State Building appears and disappears behind the interposing structures. This brings to mind a theory Whitney has about the height of skyscrapers. Obviously big cities have more tall buildings than small cities, but the height of the tallest building in a metropolis doesn’t bear a strong relationship to its population; based on a sample of 46 metropolitan areas around the world, Whitney has found that it tracks the economy of the region, approximating the equation H=134 + 0.5(G), where H is the height of the tallest building in meters, and G is the Gross Regional Product, in billions of dollars. But building heights are constrained by engineering , while there’s no limit to how big a pile you can make out of money, so there are two very rich cities whose tallest towers are lower than the formula would predict. They are New York and Tokyo. Also, his equation has no term for “national pride,” so there are a few outliers in the other direction, cities whose reach toward the sky exceeds their grasp of GDP: Dubai, Kuala Lumpur.
No city exists in pure Euclidean space; geometry always interacts with geography and climate, and with social, economic and political factors. In Sunbelt metropolises such as Phoenix, other things being equal the more desirable suburbs are to the east of downtown, where you can commute both ways with the sun behind you as you drive. But where there is a prevailing wind, the best place to live is (or was, in the era before pollution controls) upwind of the city center, which in London means to the west. Deep mathematical principles underlie even such seemingly random and historically contingent facts as the distribution of the sizes of cities within a country. There is, typically, one largest city, whose population is twice that of the second-largest, and three times the third-largest, and increasing numbers of smaller cities whose sizes also fall into a predictable pattern. This principle is known as Zipf’s law, which applies across a wide range of phenomena. (Among other unrelated phenomena, it predicts how incomes are distributed across the economy and the frequency of the appearance of words in a book.) And the rule holds true even though individual cities move up and down in the rankings all the time—St. Louis, Cleveland and Baltimore, all in the top 10 a century ago, making way for San Diego, Houston and Phoenix.
As West and his colleagues are well aware, this research takes place against the background of a huge demographic shift, the predicted movement of literally billions of people to cities in the developing world over the next half century. Many of them are going to end up in slums—a word that describes, without judgment, informal settlements on the outskirts of cities, generally inhabited by squatters with limited or no government services. “No one has done a serious scientific study of these communities,” West says. “How many people live in how many structures of how many square feet? What is their economy? The data we do have, from governments, is often worthless. In the first set we got from China, they reported no murders. So you throw that out, but what are you left with?”
To answer those questions, the Santa Fe Institute, with backing from the Gates Foundation, has begun a partnership with Slum Dwellers International, a network of community organizations based in Cape Town, South Africa. The plan is to analyze the data gathered from 7,000 settlements in cities such as Mumbai, Nairobi and Bangalore, and begin the work of developing a mathematical model for these places, and a path toward integrating them into the modern economy. “For a long time, policy makers have assumed it’s a bad thing for cities to keep getting larger,” says Lobo. “You hear things like, ‘Mexico City has grown like a cancer.’ A lot of money and effort has been devoted to stemming this, and by and large it has failed miserably. Mexico City is bigger than it was ten years ago. So we think policy makers should worry instead about making those cities more livable. Without glorifying the conditions in these places, we think they’re here to stay and we think they hold opportunities for the people who live there.”
And one had better hope he is right, if Batty is correct in predicting that by the end of the century, practically the entire population of the world will live in what amounts to “a completely global entity...in which it will be impossible to consider any individual city separately from its neighbors...indeed perhaps from any other city.” We are seeing now, in Bettencourt’s words, “the last big wave of urbanization that we will experience on Earth.” Urbanization gave the world Athens and Paris, but also the chaos of Mumbai and the poverty of Dickens’ London. If there’s a formula for assuring that we are headed for one rather than the other, West, Koonin, Batty and their colleagues are hoping to be the ones to find it.